Saving Money: School District Consolidation vs. Breaking Up Big Districts

Author
Byron Schlomach
Abstract
It is natural to conclude that a great deal of money could be saved with school district consolidation – since every district has to have a superintendent, a school board, and administrative staff. The data, it turns out, do not support this intuitive conclusion. In fact, the biggest savings would likely come from dividing the largest districts in the state.
Full Text HTML
Saving Money: School District Consolidation vs. Breaking Up Big Districts
Byron Schlomach
Given the list of over 500 school districts in Oklahoma, with 300 of them having fewer than 500 students, it is natural to conclude that a great deal of money could be saved with school district consolidation. After all, every district has to have a superintendent, a school board, and the administrative staff required for district processes. Every district has its own procurement staff and procedures, contracting expenses, and transportation management systems as well. Surely, with consolidation a huge amount of needless duplication could be eliminated and expenses saved statewide.
The data, it turns out, do not support this intuitive conclusion.
Oklahoma School Districts 2016 All-Funds Spending
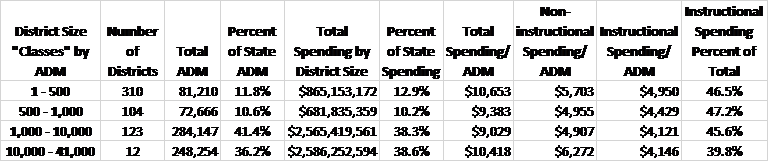
Notes: ADM = Average Daily Membership
Charter schools, included in calculations, tend to pull down average spending.
Full spreadsheet available at www.1889institute.org/ed-finance.html.
Source: Oklahoma Cost Accounting System, Oklahoma Department of Education
The table shows that while there are lots of small districts and the 1-500 category spends more per student than any other size, these small districts, in total, spend a third as much as the 12 largest districts in the state. The reason is that despite the high number of districts in the small size range, they educate relatively few students. Obviously, the big money in school districts is in those with over 1,000 students. These 135 school districts spend a total of $5.1 billion while the other 414 districts spend $1.5 billion.
A look at total spending per student (measured according to Average Daily Membership) follows a pattern of first falling and then rising as school districts get bigger. The pattern where total costs per student (average costs) first fall and then rise with size is a familiar one to economists and managers of large firms. At small sizes, expanding enterprises experience falling average costs (economies of scale). At larger sizes, they experience rising average costs (diseconomies of scale). This is especially true for the non-instructional portion of spending per student. Instructional costs fall and then rise only slightly.
Economies (falling average costs) come from consolidating management functions and using fewer teachers to teach the same number of students, given that very small districts often have classes of a dozen or fewer students. Diseconomies come from districts getting so large that they are unwieldy to manage. Feedback to management is more difficult. School board members become more answerable to district employees (who vote) than to the wider public and parents. Consequently, large districts, as reflected by the numbers, become much less efficient and more costly.
Now consider two possible policy choices: 1) Consolidation of small districts, versus 2) Division of large districts. Which of these is likely to result in the greatest savings? On the one hand, economies of scale from school district consolidation seems likely to reduce total costs. On the other hand, dividing large districts and reversing diseconomies would also likely reduce costs.
As it turns out, if all districts with fewer than 500 students were consolidated so that their total spending per student were reduced to that of districts in the 500-1,000 size class, there would be $103 million in savings. That is substantial. But, what if districts with more than 10,000 students were divided so that their spending per student dropped to that of districts in the 1,000-10,000 range? The potential savings are more than triple the consolidation hypothetical, at $345 million. Even if spending per student only dropped to that of the 500-1,000 range as a result of division, the savings, at $257 million, would more than double consolidation’s savings.
Both of these numbers are big, $1 billion and $3.5 billion ($4.5 billion total) in savings over ten years for consolidation and division, respectively. However, three issues should be considered. First, these are theoretical savings that may or may not be truly achievable. Second, it is assumed that these two potential policies are equally realistic. And third, the analysis’ basis of comparison is on the number of students, as if the aim of education is to just crank students through the system. What about student success?
Taking the last issue first, it turns out there is research that indicates districts smaller than 10,000 students, and especially smaller schools, yield better student outcomes.[1] They can also be more efficient.[2] This is consistent with the pattern in the table.[3]
Now consider the first and second issues. Is it realistic to believe that, as a practical matter, all the small districts can be consolidated in a cost-effective manner? Some, no doubt, can be. But, geography will play a part in preventing the consolidation of many small districts partly because of low population density and transportation issues. On the other hand, it is a very realistic possibility that large districts can be divided relatively easily. Put another way, the savings from division are far more likely to occur and be substantial than savings from consolidation. To what extent school management might achieve actual savings would vary.
Conclusion
Small districts can be consolidated for savings where it is geographically practical. Even more substantial savings are to be had, and can more realistically be expected, from dividing the dozen very large school districts where 40 percent of the state’s children currently matriculate.
[1] Driscoll, Donna, Dennis Halcoussis, and Shirley Svorny, “School District Size and Student Performance,” Economics of Education Review, 22 (2003), 193–201, http://citeseerx.ist.psu.edu/viewdoc/download?doi=10.1.1.465.2060&rep=rep1&type=pdf.
Barnes, Glenn E., Jr., School District Size and Differences in Student Performance as A Function of Programmatic Enrollment: A Multiyear, Texas Statewide Analysis, dissertation, Sam Houston State University, May 2016, ProQuest Dissertations Publishing, 2016, http://search.proquest.com/openview/4f93b53371217cccb20918f796d410f4/1?pq-origsite=gscholar&cbl=18750&diss=y.
Stevenson, Kenneth R., School Size and Its Relationship to Student Outcomes and School Climate: A Review and Analysis of Eight South Carolina State-wide Studies (Washington, DC: National Clearinghouse for Educational Facilities, April 2006), http://www.ncef.org/pubs/size_outcomes.pdf.
[2] McCutchen, Kelly and Christine P. Ries, Proposed Dunwoody Independent School District Financial Feasibility, Financial Report for City of Dunwoody, 2013, http://www.dunwoodyga.org/upload/Get_Involved/DISD-report131123-1800-final.pdf.
[3] Student outcomes would be a better basis for an output-based average cost discussion, but such a measure is not widely accepted or computed.