Wind Energy in Oklahoma: A Costly Solution in Search of a Problem

Author
Robert Michaels
Abstract
This paper rigorously demonstrates that wind electrical generation is very costly and that subsidies for wind energy through tax credits at the federal and state levels merely hides these costs even as they drive increased wind energy investment. What’s more, wind generation accomplishes little in reducing carbon-dioxide emissions and, even if it did, potential reductions in Oklahoma would be insignificant globally. Finally, while wind power subsidies destabilize Oklahoma’s state finances, they provide a negligible amount of property tax funding to schools.
Additional contributions in the paper are provided by Per Bylund, Paul C. Knappenberger, and Byron Schlomach.
Full Text HTML
Wind Energy in Oklahoma: A Costly Solution in Search of a Problem
Primary Author
Robert Michaels
Professor of Economics
California State University, Fullerton
Contributions from
Per Bylund
Assistant Professor of Entrepreneurship and
Records-Johnston Professor of Free Enterprise
Oklahoma State University
Paul C. Knappenberger
Assistant Director, Center For The Study Of Science
CATO Institute
Byron Schlomach
Scholar in Residence,
Institute for the Study of Free Enterprise, Oklahoma State
University
Director, 1889 Institute
Edited and Supervised by the
Institute for the Study of Free Enterprise
Oklahoma State University
Table of Contents
Executive Summary
Chapter 1. Introduction to Generation Policy
I. Overview
II. Introducing Electricity
A. Generation
B. Renewables
Aside: Mitigating Climate Change Is No Reason to Justify Wind Power
in Oklahoma
Chip Knappenberger
III. Regulation and Law
A. Regulation
B. The Legal Environment of Wind Power
IV. Electricity’s Uniqueness
A. The Economic Properties of Power Flows
B. The Regional Operator and Its Markets
C. Why Regulation and the SPP Market Matter for Oklahoma
V. Conclusions
Chapter 2. The Economic Value of Wind Power
I. Introduction
A. Is the Wind Free?
B. Types of Intermittency
II. Standards for Comparison
A. Which Costs, Which Values?
B. How Valuable Is Intermittent Power?
III. Costs and Benefits of Alternative Investment Decisions
A. Beyond Levelized Costs
1. Avoided Costs: Emissions
2. Avoided Costs: Energy
3. Avoided Costs: Capacity
IV. Accounting for Carbon
V. Conclusions
Chapter 3. Wind Power for Oklahoma: Benefits Now, Costs Later
I. Introduction
II. Dollars and Cents: Which Comparisons Matter and Which Comparisons
Mislead?
A. Where Power Prices Originate
B. How the SPP Reduces Costs
III. Performance and Wealth Transfers in the SPP Integrated Market
A. The Consequences of Economic Dispatch
B. Application to the SPP Markets
C. Operational Issues in the SPP
IV. Looking Ahead
Chapter 4. The Bottom Lines
I. Introduction
II. The PTC and Accelerated Depreciation for Wind Facilities
A. Their Provisions
B. The Economic Effects
Aside: The True Cost of a Tax Credit
Per Bylund
III. Federal Policies in the Long-run
A. Investment and Markets
B. Constraints on Growth
C. The Effects on SPP Markets
IV. Summing Up Oklahoma State Wind Policy
Written by Byron Schlomach
Executive Summary
As Oklahoma’s legislature debates ending the state’s tax incentive for
wind-generated power, arguments continue to be made that wind is good
for the state’s electricity consumers as well as for the state’s
economy. This paper examines the impact of wind on the state. It finds:
- Today, Oklahomans enjoy the benefits of an excess supply of
electrical energy. There does not appear to be the need for
construction of new generation facilities of any type in the near
future. - The construction of wind turbines in Oklahoma has been driven by
the federal production tax credit, not any Oklahoma state policy. - Oklahoma reached its voluntary renewable portfolio
standard some time ago. - Wind power does not provide environmental benefits to the state.
- Wind power does not provide significant financial resources to K-12
schools. The Oklahoma Zero-Emissions credit presents significant
risk to the state’s fiscal outlook.
The strongest arguments to support the claim that wind is a boon to the
economy are that wind, as a form of energy, is free, and that wind
power producers often offer their power at a zero or even negative
price. But wind’s true economic impact is so blurred by state and
federal tax and energy policies that it is nearly impossible for a
casual observer to put together an accurate picture of wind’s impact.
This paper is an attempt to sharpen the picture with the hope that
policy decisions will be improved. The bottom line, however, is stated
in Chapter 2, where the analysis strongly suggests that “the
utility-scale wind industry will not survive in competitive power
markets unless it is subsidized.”
Wind Power is currently subsidized through state and federal tax
policy. At the state level, new wind producers are effectively paid $5
for every megawatt-hour they produce for ten years. This is in addition
to the $23 per megawatt-hour the federal government pays these
producers for ten years (though the federal subsidy is being phased
down). At the wholesale level, the federal subsidy alone is sufficient,
under some circumstances, to allow wind producers to pay, rather than
receive payment, to load their generated power onto the electrical
grid. Properly understood, this economically unsustainable practice
alone makes it clear that low prices for wind-generated power, made
possible by government interference, obfuscate the real cost wider
society is actually paying for that power.
Economists have long shown in a variety of ways, theoretical and
empirical, that a free-enterprise system, where government plays only
referee and regulator of last resort, yields the greatest possible
benefits from mankind’s natural urge to exchange with one another.
Active government interference through misguided and excessive
regulation, direct subsidies, unequal tax treatments, and generous
legal rules only for the privileged, make society poorer than it could
otherwise be. Per Bylund, an OSU entrepreneurship professor, reinforces
this point in a separate essay provided in the paper. In fact, Bylund
argues that government attempts to stimulate innovation often actually
reduce innovation.
The primary author of this work, economist and energy expert Robert
Michaels, shows that wind power is much more costly than often thought.
Michaels’ argument can be summed up as follows. Once a basic, but
thorough, understanding is gained of how modern electrical grids work
and how important it is that energy sources be highly reliable, it
becomes clear that wind-generated power has little, if any, cost
advantage over other power sources, despite appearances to the
contrary. What’s more, the main advantage wind has, which is to reduce
carbon emissions, is not clear at all, given wind’s intermittent nature
and the need for fossil-fuel backup power plants. This last point is
reinforced by an essay included in the paper from climate expert, Paul
Knappenberger.
Chapter 1 provides an overview of electric power in the United States
and Oklahoma. It describes how the mix of electrical power sources has
changed over time, as well as the regulatory and legal frameworks
within which power generators operate. It also points out that there
are laws of nature that must be taken into account in order to maintain
a stable electrical grid that reliably provides power. Part of what
makes this possible for Oklahoma is the Southwest Power Pool (SPP), a
large, multi-state electrical network of which Oklahoma is only a part,
which is described. Finally, a basic explanation is provided of how
power flows within the SPP, and how it is that this somewhat artificial
but remarkable market, with its many mandates and regulators, insulates
us from some of wind power’s worst potential effects.
In Chapter 2, Dr. Michaels explores whether wind power is actually
economically valuable, given its intermittency (i.e., that the wind
does not blow steadily 100 percent of the time), using methodology
developed by a Brookings Institution economist. The fact is that a wind
plant rated to produce a given maximum amount of electricity can only
be counted on to produce a fraction of that amount over time. Even that
fraction, however, cannot be reliably expected to be delivered as
needed. This is because wind, even that as seemingly reliable as
Oklahoma’s, is not reliable enough as a source of power to produce the
constant voltage needed on a modern electrical grid. Wind cannot
reliably be instantly called up to cover unexpected loads, grid
interruptions, or unexpected power interruptions from other generators.
Yet, because of the far-flung nature of the SPP and the ability of that
market to accept nearly any power source that bids low enough and is
willing to pay to be admitted onto the grid, wind has been integrated
into the system. Nevertheless, this has happened at a cost as the SPP
has had to create a special side market to keep subsidized wind’s
artificially low prices from destabilizing the grid. What’s more, Dr.
Michaels shows that when wind replaces older fossil-fuel generation, it
often does not produce the value (in reduced fuel and capital costs) or
even the reduction in CO2 emissions that more modern fossil
fuel technologies often accomplish since wind does not always blow and
reserve generation must therefore be maintained.
In Chapter 3, the fact that wind might have helped to lower electricity
prices in Oklahoma is acknowledged, but only a short-sighted,
short-term basis. It is also argued that there is a hidden cost to
these lower rates. As already noted in Chapter 2, much of this cost is
in reserve generation, not to mention the impact on Oklahoma’s tax
revenue picture. There has also been a large investment in new grid
extensions and upgrades of the current SPP grid, partly to accommodate
wind. Wind’s low prices are, in no small part, made artificially
possible by mainly federal, and to a much smaller degree, state tax
subsidies. Ultimately, given that SPP gives wind generation only 5
percent credit as part of its reserves that can be called up when
needed, it would take 10,000 megawatts of wind generation to replace
only 500 megawatts of, say, coal units. Wind can only be absorbed as a
generator up to a very limited point.
Chapter 4 argues that given the costs of its absorption and the federal
subsidies wind has received, it is arguable that the future of wind is
higher costs, not lower, for consumers. At best, wind power has made a
very limited contribution to property tax revenues and is not likely to
make a large contribution in the future. Instead, wind presents a
significant risk to Oklahoma’s future state revenue outlook due to the
subsidies.
Chapter 1
Introduction to Generation Policy
I. Overview
Electricity is undergoing transitions that promise to leave posterity
with an industry that today’s citizens would scarcely recognize. On one
side, technological change and politics are altering the mix of
resources that produce the nation’s power. The technologies include
hydraulic fracturing that virtually assures centuries of inexpensive,
secure, and clean natural gas, alongside inventions that improve the
efficiency of “renewable” power generated from wind and the sun. At the
same time, concerns about climate change have disfavored the coal that
once produced over 50 percent of the nation’s power.
The industrial organization of electricity was once the near-exclusive
domain of regulated monopoly utilities that owned and operated the
preponderance of generation and transmission. Now, utilities are
de-integrating into entities that increasingly obtain their power
through contracts and market transactions with independent generators.
They have ceded control over their high-voltage transmission to
regional transmission operators (RTOs) that are responsible for
reliable and economical power flows over large geographical areas. RTOs
that comprise two-thirds of the nation’s power consumption now
administer competitive power markets whose prices give generators and
consumers minute-by-minute signals that can better guide their choices
of near-term exchanges and investments in future generation and
transmission.
All of these forces operate in a federalized political system. This
means that the energy futures of Oklahoma households and businesses
will result from both national and state forces. Oklahoma’s power
suppliers are no longer exclusively local utilities. Instead, its
utilities obtain power for their customers on an hourly basis from
generators as distant as the Dakotas. Oklahomans pay electricity prices
that reflect forces of supply and demand beyond the local level in
addition to local developments. Oklahoma’s region, covered by the
Southwest Power Pool, is a unified market into which a generator can
only sell if it bids prices that are lower than those of its
competitors, who today number in the hundreds.
An Oklahoman still pays a light bill to a familiar utility corporation
or municipality, still regulated by the Oklahoma Corporation Commission
to guard local reliability and to decide on power sources with which it
will build or contract. In little more than a decade those sources have
been transformed. Giant wind turbines, whose existence is significantly
owed to the federal Production Tax Credit, worth one-third of the
retail price of electricity in Oklahoma, cover Oklahoma’s western area.
With federal policy’s assistance, wind turbines exploit Oklahoma’s
abundant wind at a pace that sees it ranking third among the states in
wind power generation. Oklahoma, however, is beginning to face
engineering limits on its ability to absorb that power, and political
limits on feasible transfers of wealth from its households and
businesses to power producers.
The values of wind-related assets and the future importance of
renewable power both matter for Oklahoma, but the intrinsic complexity
of the power industry and its governmental relationships are
understandably confusing to non-specialists. This document attempts to
provide an overview of important facts and decisions that must be made
in the near future. Reliable electricity is not currently threatened,
but Oklahomans have been left largely in the dark about important
choices being made for them.
This chapter begins with an overview of power technology and markets,
then explains the regulations and laws that administer the state’s
electrical system. Chapter 2 explains the economics of choices among
alternative sources of power and factors to be considered. Instead of
being costless because air is “free,” wind is among the costliest of
generation methods. To understand how power bills come to be, Chapter 3
examines the markets operated by the Southwest Power Pool (SPP) and how
they distribute the benefits of competition over Oklahoma and states
interconnected with it. Chapter 4 attempts to summarize issues
surrounding the costs and benefits of Oklahoma’s electricity policy, an
intrinsically frustrating task because markets and regulation render
dollars-and-cents comparisons nearly impossible to make. The chapter
concludes with an economic critique of wind power and sums up the issue
in a state context.
II. Introducing Electricity
A. Generation
Electricity starts with a generator, most likely one that uses a heat
source such as coal, gas, sunlight, or radioactivity to boil water.
Steam turns a turbine, converting heat energy into rotary motion,
which, through windings and coils, induces an alternating current into
the grid by way of transmission (high voltage) and distribution (low
voltage) lines. The generators of greatest interest for this study are
exceptional in that they do not burn fuel. Rather, they harness strong
winds to move large rotors to ultimately send out power.
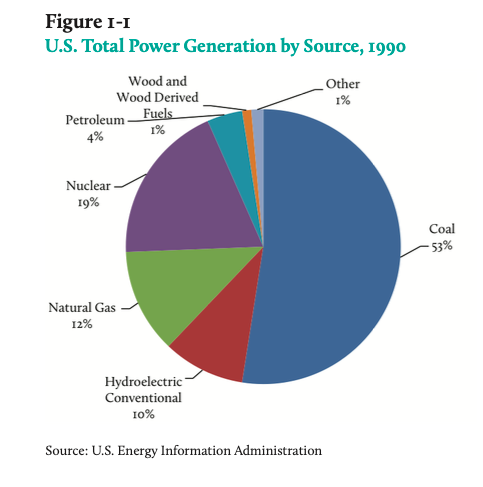
The production resources of America’s electric utilities vary
regionally, but are almost uniformly dominated by hydrocarbon fuels.
Figure 1-1 shows the 1990 percentage shares of generation by coal
(53%), natural gas (12%), nuclear (19%), hydroelectricity (10%), and a
small aggregate of miscellaneous fuels, which includes some renewables
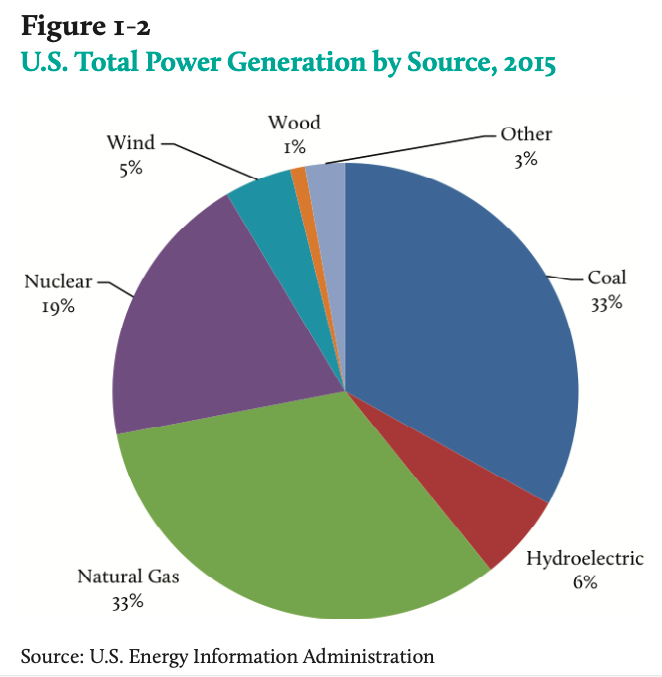
whose presence as a group was too small to be graphed. By 2015, the mix
had changed substantially. Figure 1-2 shows a 20 percentage point drop
in coal (to 33%) a rise in gas (33%), little change in nuclear and
hydroelectric shares, and a still-small role for renewable power.
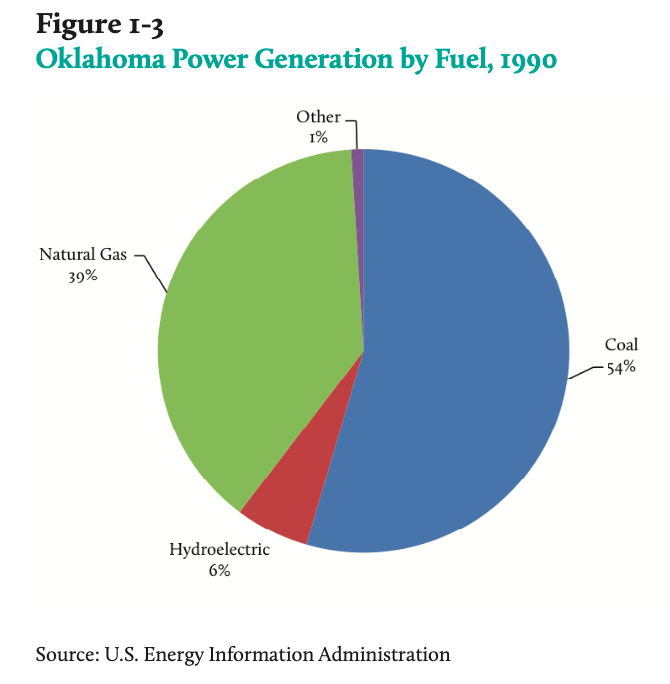
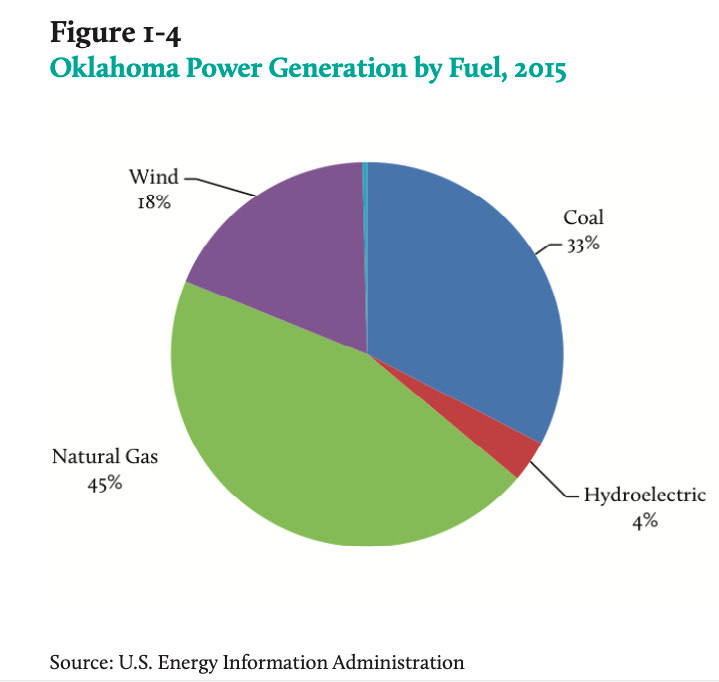
Oklahoma’s story has both similarities and differences with the
national one. Between 1990 (Figure 1-3) and 2015 (Figure 1-4) it had no
in-state nuclear generation, and hydropower was only a tiny presence.
Oklahoma also mirrored the 20 percentage point national decline in
coal’s share of power generation. Gas-fired power also rose, but by
relatively less than the national rate. The most striking difference is
Oklahoma’s increasing use of wind power, which rose from nearly zero in
1990 to 18 percent of the state total in 2015 and continues to grow.
This change alone is bringing important political and economic issues
to the fore.
It is easy to explain the changes. In the 1970s, gas was commonly seen
as on the brink of exhaustion, a belief that proved monumentally
mistaken. Federal wellhead price controls from the 1950s created a
shortage that ended in the mid-1980s with price decontrol and
restructuring of pipelines. Since decontrol, new discoveries in the
U.S. and Canada have steadily increased reserves. After 2010 the
resource base grew even more with the development of hydraulic
fracturing (“fracking”) and related extraction techniques.
Coal’s abundance and deliverability made it the dominant generator fuel
for much of the previous century. It did, however, have one major
problem: unlike gas, its combustion released harmful emissions, most
importantly oxides of nitrogen and sulfur, mercury and particulate
matter. Controlling them was feasible, but as environmental regulations
increased, the costs rose. Newly abundant gas was an alternative whose
capital costs of generating a megawatt (power plant construction) were
well below coal’s, and whose emissions (primarily oxides of nitrogen)
was cheap to abate.
As for the other fuels, hydroelectric production was maintained between
1990 and 2015, but a scarcity of environmentally acceptable dam and
lake sites foreclosed future growth. Spectacular construction cost
overruns in the 1980s and public fears of disaster doomed nuclear
power. Over the period, however, many aging reactors continued to
produce so efficiently that its percentage share of total generation
remained nearly constant.
B. Renewables
Turning to the new century, policy makers increasingly accepted
scientific claims that the accumulation of carbon dioxide and other
“greenhouse gases” (primarily methane) could bring about catastrophic
increases in the planet’s average temperature. After people and
animals, fossil fuel power plants have been the most important carbon
emitters worldwide. Concerns about future environmental policy
discouraged coal-fired plants, whose carbon emissions per megawatt-hour
(MWh) of power generated significantly exceeded those of gas. Starting
in the 1980s, the operating efficiencies of gas generators grew while
those of coal plants stagnated. The stage was set for gas to rise and
coal to fall. If carbon was the problem, there was wealth to be made by
finding politically acceptable (i.e., non-nuclear) power sources that
did not emit it. Renewables had been in operation long before carbon
became a policy concern, but they could only grow in political and
economic importance.
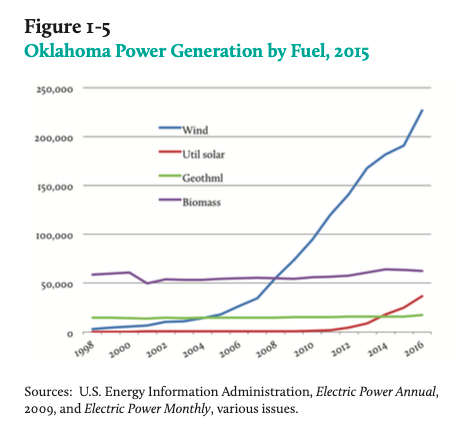
Figure 1-5 shows annual power generation from resources legally defined
as renewable since 1990, although there is little value in claims that
coal and oil are “finite” or “exhaustible.” They are continually
renewed by discovery and innovation, activities that will continue as
long as they have economic value. Hydroelectric power renews itself
after rain or snow falls, stored as water behind dams and dispatched as
needed. Farm and forest waste (“biomass”) return after each harvest to
be burned in generators that a grid dispatcher can control as needed,
and the same holds for heat from geothermal wells. Sunlight and wind
will never be exhausted, but arrive so randomly that they cannot by
themselves produce the steady power flows that most consumers want.
Storage technologies that can be applied to sunlight and wind power,
such as compressed air, flywheels and batteries, remain too costly for
all but a handful of applications. This said, wind now dominates
production capacity for renewables, although solar power’s slower
development has recently risen sharply.
III. Regulation and Law
A. Regulation
State.
Any study of Oklahoma energy policy must be informed by a discussion of
the opportunities and constraints that governments place on power
markets. Although there are 51 state regulatory agencies (Including the
District of Columbia), all have similar basic procedures and the same
relationships with federal regulators. All power producers and
consumers are also within the jurisdiction of numerous federal and
state statutes (e.g. environmental and health). Individual states
introduced regulation over the first four decades of the twentieth
century. Appointed regulatory commissions (elected ones in a minority
of states) took over some local functions and replaced the near-anarchy
of local land use and franchise laws. Today, a commission has
jurisdiction over rates and service practices of its state’s
distributors, who are generally granted monopolies on electricity sales
in defined areas.
Important aspects of the electricity industry, including high-voltage
transmission and low-voltage distribution lines, are acknowledged to be
“natural monopolies,” meaning that a single high-capacity transmission
line can move power between two points more cheaply than two competing
ones. If so, the regulatory agency must set rates and service practices
that allow the lower costs to be enjoyed by consumers. It does so by
setting rates that recover the regulated firm’s prudently incurred
costs of service while allowing it to earn returns sufficient to
attract capital. The firm thus regulated has a “public utility”
obligation. Beyond rate regulation, it cannot price discriminate among
otherwise similar customers, cannot refuse to serve a customer willing
to pay the rate, and must provide for the future by building facilities
in anticipation of demand. The utility can be retrospectively penalized
for poor performance, but few utilities have ever incurred significant
penalties for investments that were subsequently deemed imprudent.
Federal.
State regulation was well-adapted to the simple electrical technologies
that characterized the first half of the twentieth century. Generators
were relatively small and engineering limits on transmission
effectively required that most utilities be self-sufficient in
generation. Within their service territories, utilities monopolized
virtually all aspects of power production and distribution. During the
twentieth century, the onset of long-distance transmission, large
efficient generators, and advances in controlling frequency (60 cycles
per second) brought issues that crossed state lines and impinged on
functions of the federal government. In the 1930s, these functions came
under the jurisdiction of the Federal Power Commission, now the Federal
Energy Regulatory Commission (FERC).
All utility sales of electricity to final (“retail”) consumers are
subject to state regulation, while FERC regulates access and rates for
interstate transmission, hydroelectricity, and the regional
transmission operators discussed below. Its jurisdiction is
misleadingly called “wholesale” transactions, which are defined not by
volume but by law: power sales intended for resale by the purchaser are
under FERC, even if they are between a generator and a utility in the
same state. Unlike many state regulators, FERC has taken an active
interest in fostering competitive power markets under both Republican
and Democrat administrations.
B. The Legal Environment of Wind Power
The 1970s saw the advent of “energy crises” – shortages that in the
main had resulted from price controls on energy. Perhaps
misunderstanding supply and demand, politicians who hoped to fend off
resource exhaustion and encourage new power sources enacted the Public
Utility Regulatory Policy Act of 1978 (“PURPA”). This seemingly minor
law would determine important aspects of electricity’s future. PURPA
impinged on state regulation by requiring utilities to purchase power
generated by non-utilities with whom they could have previously refused
to deal. The purchase price was set by state regulators as the “avoided
cost” of power from generation, including renewables, they would
otherwise have had to buy or build. Government’s expectation that
renewable power would be of little commercial importance turned out to
be wrong, as the law soon established a new industry of non-utility
generators whose output utilities could not refuse if priced right. In
those early days, producers of wind and solar power found PURPA’s
purchase requirements to be valuable financial support.
PURPA compelled utilities to purchase non-utility (“independent”) power
but let states determine the avoided cost. A few states, most
importantly California and New York, based their payments on
astronomical expectations of higher future gas prices that stimulated a
crush of renewable producers. PURPA, however, did more than change the
types of power and identities of the generators utilities would deal
with. It also encouraged environmentalists to join the regulatory
process, sometimes as matters of state law, and their coming would
change the basic criteria for power procurement.
Utilities’ practice had long been to choose investments in regulated
generation and transmission that would minimize the cost of power to
their customers. Environmentalists argued that this view was seriously
incomplete, because low-cost measures to reduce power demand might
leave consumers with even lower costs than investments in generation.
As of 2011, 27 states (including Oklahoma) used variants of “Integrated
Resource Planning” (IRP) that intended to examine all alternatives and
take account of hitherto neglected costs such as environmental
pollution and visibility. Factoring in asserted dollar values for such
environmental amenities could change a decision from construction to
conservation.
States can set rules that encourage investment in renewable power, and
they can also specify quotas for renewable power. As of today, 29
states and the District of Columbia have enacted renewable portfolio
standards (RPS) that impose compliance timetables for renewable power
as a proportion of the state’s power mix. A utility can often satisfy
its state requirement by purchasing renewable power from a distant
generator or by providing regulators with evidence that it has obtained
the required number of state-issued Renewable Energy Credits. It is
generally acknowledged that RPS has been an important influence on the
growth of investment in renewables. Oklahoma does not have an RPS, but
has enacted non-binding goals for future renewables. Its 15 percent
renewable energy goal came with legislation in 2010. By 2013 it had
already met its 2015 goal.
IV. Electricity’s Uniqueness
A. The Economic Properties of Power Flows
Thus far, we see a large and complex industry, but there are
idiosyncrasies that might make it truly exceptional. On the demand
side, interruptions in service can be very costly, or at minimum
consumers who lose service typically find it annoying. Small users have
no ready ways to fill unpredictable service gaps. Some larger users can
avail themselves of backstop arrangements or postpone production until
an outage is corrected, but this too is inconvenient and costly. Power
cannot be stored except at high costs, in facilities that include
batteries and hydroelectric dams, and consumption must coincide with
production because it moves at the speed of light.
Physics imposes other limits. An alternating current grid requires that
production equal consumption with zero discrepancy at all times. If
production exceeds demand the grid will soon encounter thermal limits
and fall victim to a regional outage. If demand exceeds production the
grid becomes unstable and will also collapse. Adding to the difficulty,
a power system is not like a network of water or gas pipes with valves
that can limit flows along a particular segment. Power flow is governed
by Ohm’s and Kerchoff’s laws, which determine power losses in a
network’s links according to its relative resistances.
These technical points have important consequences for wind and solar
power. Integrating their random outputs into the grid while maintaining
reliability can increase the total cost of power delivered to users as
compared to a system that has no such intermittent resources. Many wind
power producers claim these costs are irrelevant because all power
requires reserves, and in any case, wind adds power to the grid with
none of the production costs incurred by fossil fuel generators. We
consider these issues in more detail later.
With or without wind resources, access to a grid cannot be a
free-for-all. Instead, there must be someone (at times, a computer)
whose commands are law in order to match supply to demand at all times.
Hazards of generation and transmission failures require the existence
of reserve generators whose output can adjust instantly. Reserves are
also necessary to meet predictable daily consumption. Demand in most
systems peaks in the late afternoon, after which generation must be
reduced for the night. Complications abound. Some low-cost generators
with long startup times can be valuable tomorrow afternoon, but leave
the system operator to manage fluctuating “minimum load“ conditions in
the predawn hours using higher-cost, fast-start generators. For
Oklahoma, all of these functions are the responsibility of the regional
transmission operator, to whom we turn next.
B. The Regional Operator and Its Markets
Advances in electrical and computer technology over the last
half-century have dramatically changed how power is produced and
reliably maintained. Instead of localized islands, all transmission in
the U.S. is integrated into three grids – the Eastern Interconnection,
the Western Interconnection, and the Electricity Reliability Council of
Texas, of which the latter does not cross state lines.
Interconnections and coordinated operation make it possible to lower
the costs of delivered power in many ways. A market participant
(possibly a utility or independent power producer) whose generators
burn a cheaper fuel than another can exchange energy with a higher cost
participant. The purchaser will pay less for the power than otherwise
and the seller will recover more than the incremental cost (marginal
cost) of generating it. When fuel prices change, trade can flow in the
other direction. Trade also allows us to take advantage of seasonality.
Utilities in the desert southwest import power in summer from
hydroelectric facilities in cooler Oregon, and when Oregon’s electrical
heating demand rises during the winter, the southwest can profit. Under
regulation, utilities must channel some of the savings into customers’
bills.
There are numerous other activities that benefit both parties. Two
interconnected utilities can (if they have transmission capacity)
reduce expenses by sharing reserves to call upon in emergencies. They
can plan new transmission and jointly construct new transmission that
increases and broadens the exchanges they can make with each other. An
economical large generator may be too costly for a single utility to
own, but be worth building under a sharing contract.
Oklahoma’s two largest utilities, Oklahoma Gas & Electric and
Public Service Company of Oklahoma (which is part of the American
Electric Power holding company) now obtain virtually all of their
high-voltage (“bulk”) power through the Southwest Power Pool, a
nonprofit entity headquartered in Little Rock and regulated by FERC.
The SPP is a Regional Transmission Operator (RTO), one of several whose
grids cover most of the nation’s territory (and Canada’s), with the
conspicuous exceptions of the mountain west and southeast.
Utilities in an RTO continue to own transmission but surrender
operating control of it to the RTO, which is chartered to minimize the
costs of power in its territory through nondiscriminatory measures. The
transmission owners are paid in accordance with established federal and
state rules that allow recovery of their costs and a return sufficient
to attract capital. RTOs have certain requirements (e.g. that a member
utility own or have generation capacity under contract sufficient to
serve its peak load). SPP’s membership and market participants include
172 utilities, independent power producers, independent transmission
companies, power marketers, and state agencies and municipal utilities.
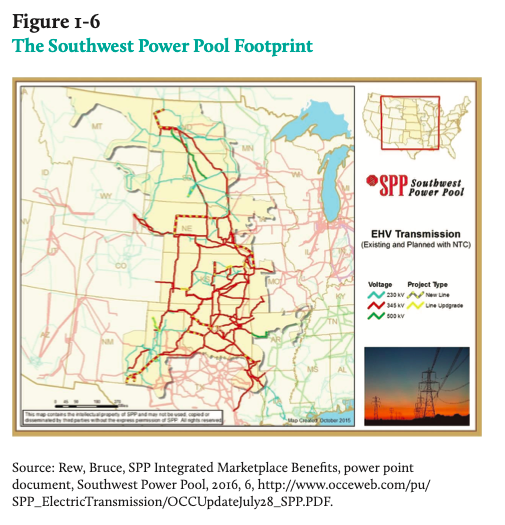
Over 75 years, the SPP evolved as opportunities arose in power
technology and the law to facilitate exchanges and deliveries under
contracts. Its territorial footprint (see Figure 1-6) is dense with
high voltage lines, but until recently the available technology often
limited transactions to subsets of the footprint. The limits were
partly due to line (voltage or power) losses that made long-distance
transmission impractical, and in part due to operational problems
caused by extensive and uncontrollable flows. Instead of a unified
entity with authority over a wide area, until 2014 the SPP consisted of
16 “balancing authorities,” each under the control of a
transmission-owning utility. All that changed in October 2014 when the
SPP introduced its “Integrated Market.” The Integrated Market is a
single organization to operate the entire area and maintain reliability
as necessary. In effect, the introduction of the Integrated Market
opened a complete market to facilitate mutually beneficial transactions
between generators and distributors that had previously not been
possible.
The SPP has also taken over authority for expansion of transmission
capabilities over the entire area, and has introduced competition into
the process. The SPP plans new lines by consensus, but the builder is
determined by bidding rather than (as in former times) defaulted to the
incumbent utility in its area. The value of unification has been clear
and widespread. During 2014 the net savings in power costs for SPP
members as a group was $380 million, and 2015 savings were expected to
be $422 million. Total settlements (payments for power flows) in 2015
were $14.6 billion.
To understand wind power in Oklahoma requires an introduction to some
of the SPP’s markets, through which the preponderance of power in it
passes (financially rather than physically) and is priced by bidding.
Like other RTOs, SPP operates under a “two-settlement” system that
facilitates reliability and price discovery. In the 24-odd hours before
a given date, there is a “day-ahead” market in which generators submit
bids to sell energy. Combining bid information with system forecasts
(including weather and other particulars) allows the RTO to determine
day-ahead prices. As in any competitive market, all winning bidders are
paid the highest-price-accepted offer.
The SPP also takes steps to ensure the system’s electrical security and
reliability. It may order some otherwise uneconomic activity that is
necessary to maintain the grid’s flows, such as readying otherwise
uneconomic generators to run (“must-run” contracts due to their
electrical situations, made whole from SPP revenues), or reprioritizing
generation to satisfy transmission constraints.
The day-ahead market is one of a number of markets. Like other RTOs SPP
operates bid-based markets for “ancillary services” that will be called
upon for reliability, ensuring that supply equals demand at all times
and everywhere on the grid. Among the services are “regulation” or
“load following” that precisely adjust inflows and outflows at hundreds
of junctions. To assure costs are minimized, generator outputs all over
the SPP’s footprint are optimized as often as every four seconds, from
North Dakota to Texas. As the day passes or emergencies occur, other
ancillary services markets operate. They include “spinning reserves,”
whose power can be made available instantly, and non-spinning reserves
that may be called upon (and paid) to begin operation if it looks like
they might be needed. Units like these receive a payment (also
bid-based) for availability as well as the SPP energy market price if
they run.
Things can change between the day-ahead market and the “real time”
market. New information about market or grid conditions will arrive and
may induce some generators to change their bids and some others to
startup and sell into the market. An expected weather-sensitive load
may not materialize or a generator that was idle may unexpectedly
become operational. Real-time markets process the shortest-term
increments of supply and demand, producing a market-clearing energy
price several times an hour. There are still other transactions that
help ensure that markets function efficiently.
An eligible market participant (whether or not it owns a generator) can
further facilitate price discovery and efficiency by “virtual bidding.”
For example, assume that a generator whose bid in the day-ahead market
was cleared (committed to run), now thinks weather conditions indicate
that real-time prices tomorrow will be lower. The generator generally
cannot withdraw the bid from the day-ahead market, but can buy it back
in the real-time market, at a profit if the guess was right. (Someone
who does not own generation and is financially qualified can also make
such a transaction.) Research in other RTOs have shown that virtual
bidding generally brings about convergence between day-ahead and
real-time prices, thereby facilitating market efficiency.
A final function of the SPP is a valuable byproduct of its grid
operation and extremely important in places like Oklahoma where
transmission capacity has not kept pace with generation. Like other
RTOs, the SPP uses Locational Market Prices (also called nodal prices)
– prices generators must pay to access the grid and send out power – to
regulate generator access to transmission lines at various points in
the grid. When the wind is up, wind generators want to send out more
power than there is transmission capacity, and links of the system will
become congested. To prevent congestion, SPP recalculates nodal prices
at 3,000 points on the grid where generators or loads are located every
five minutes. When a link goes out, prices all over the grid change to
reflect the new scarcity situation. A transmission path whose price is
frequently high signals to the RTO and transmission owners that an
expansion of capacity would be a productive investment.
There are still other financial and operational dimensions of
transmission. A generator (or its creditors) may value a predictable
income stream, and the SPP allows hedging against adverse nodal price
movements. Parties that want predictability in transmission charges can
hedge in the market for “congestion revenue rights.” Here, the RTO
studies flows in order to determine safe loadings on an important
transmission path and then auctions off rights to use the link,
generally for a year. The holder of such a right may use the link for
its own power flows, or sell or rent the rights to that revenue.
C. Why Regulation and the SPP Market Matter for Oklahoma
In the old world of utility regulation, a single company owned
generation, transmission and distribution. Essentially, the utility
would estimate the rates needed to recover expenses and make prudent
investments in new facilities. That revenue requirement would then be
approved by its state regulatory commission. It was relatively easy for
an interested citizen to determine the impact of a given generation
project on rates. The vertical de-integration of utilities remains a
strong force, and so does the independent power industry, which often
competes with utilities to construct new plants. One common arrangement
between an independent generator and a utility is a longer-term
contract to buy a plant’s power, with adjustments to account for fuel
prices and changes in environmental requirements, among other things.
Whether the plant’s owners make a profit is not a concern of either the
utility or its regulators.
The situation of a wind generator is more difficult to analyze. The
owner of the unit almost certainly has a power purchase agreement for
its output, possibly with the regulated utility. Being in a competitive
market, the detailed terms of the contract may well be confidential. If
this is a typical wind unit, it will be under a long-term fixed price
contract with the utility. This is reasonable because the wind unit
brings few pricing surprises with it; most importantly there are no
fuel costs. Now assume that this is taking place in the SPP. Whatever
the terms of its contract with the utility, the wind unit’s output will
get the SPP price. The wind unit’s income will bear no necessary
relationship to its construction cost as would have happened under
traditional regulation. Other aspects of wind power also contribute to
the opacity. The unit will be able to utilize the federal production
tax credit, but the cost of this stream of benefits is not borne
directly by either the utility or its customers. Whether we compare the
costs of the wind plant with a utility investment, a simple purchased
power agreement for its output, or a generator that burns another fuel,
we are dealing with apples and oranges, making accurate full-cost
comparisons difficult.
V. Conclusions
This introductory chapter has necessarily touched on a large number of
topics. Electricity is one of the most necessary of commodities in a
modern economy, and among the most idiosyncratic. Power markets create
the same benefits as other markets. They allocate scarce resources to
where they can create the most economic benefit and distribute goods
and services in accordance with the public’s preferences and budgets.
Investment risks are borne, in the main, by investors themselves, who
have stronger incentives to create economic value than government
bureaucrats. The benefits to consumers and producers of emerging
competitive electricity markets exist in the here and now.
Renewable power policies, on the other hand, are largely in search of a
rationale beyond politics. Their roots lie in the “energy crises” of
the 1970s and 1980s, when mismanagement of important markets led
policymakers to believe that the world would soon exhaust its
hydrocarbon resources. Renewable power quotas and regulatory
preferences for wind power are hard to rationalize economically but are
straightforward in their politics. This study attempts to shed new
light on wind-generated electricity, an energy source so often
misunderstood because it seems intuitive that the wind is free. It is
not.
A generator is said to be dispatchable if its output can be raised or
lowered with certainty when ordered by the system operator. If a new
dispatchable generator is added to a grid, its strengthens the
performance of the entire system because it adds reliability. An
intermittent wind generator performs no such service because the
operator cannot count on it. That generator degrades the performance of
the system in important ways, and profits from a regulatory pricing
system that fundamentally misapprehends its costs and benefits. The
next chapter discusses these points in more detail.
Chapter 2
The Economic Value of Wind Power
I. Introduction
A. Is the Wind Free?
Whether from wind, gas or coal, almost all of Oklahoma’s power passes
through the markets of the Southwest Power Pool (SPP), and like any
competitive market, SPP’s converges to a single price, adjusted for
transmission conditions and charges. Wind power advocates often argue
for its superiority by claiming that “the wind is free, just like air,”
but wind and air are critically different. Air is reliably available at
all hours of the day, and (disregarding pollutants) is of dependable
quality. Wind’s randomness makes it unreliable over any intervals that
matter for power consumers.
Wind advocates often make statements about how a wind generator “will
produce enough power to light X thousand homes.” The problem is that
hardly anyone would voluntarily live where the only energy source was
local wind. Many people will probably say that they would rather have
reliable power for several hours of the day and darkness for the
remainder. Human activities that range from reading to cooking require
steady flows of quality power (no flickering) if they are to deliver
their promised benefits. If wind power is to be of any value, it must
be embedded in a grid that can instantaneously recognize, accommodate
and neutralize the effects of unpredictable interruptions.
In this chapter we examine the costs of producing a reliable power
supply in realistic settings. Specifically, we examine the choices
between renewable and nonrenewable generators in the “production” of
reliability. We will see that the two are substitutes in some ways and
complements in others and, within limits, can reduce delivered power
costs and improve reliability. Those limits, however, are surprisingly
stringent. To understand them requires that we ask and answer some
fairly simple questions about generator choice that have, until
recently, been largely neglected or misstated by advocates of
renewables. The opportunity cost of replacing efficient fossil-fueled
generators with renewables is often remarkably high. Even if we assign
high value to the avoided carbon emissions, it remains quite difficult
to make a case for renewable investments on environmental grounds.
B. Types of Intermittency
The only plausible ways to rectify wind’s intermittency are to
supplement or replace it with power from a dependable and dispatchable
resource. Batteries or other storage media are too costly to be useful
substitutes for wind, and any cell phone owner knows their limits all
too well. Other renewables such as geothermal or biomass could step in
for wind, but they generally have high capital costs and limited
availability.
There are also quality issues. The owner of a sawmill in Maine can
generate power by burning abundant wood chips, but will seldom choose
to disconnect from the grid. Instead the mill will contract to sell the
unsteady power source to a regional utility that will turn it into one
component of a reliable package. The wood-burner’s low availability
ensures that it will only run when its power is needed, but that could
be when its contribution is the difference between reliability and
blackout. The wood-burning generator is dispatchable, its power output
alterable by the system operator as necessary. Other renewables like
hydroelectric and geothermal generators are capable of following orders
in ways that wind and solar are not.
In some ways it is more helpful to view system costs as made up of
three components enumerated by German economic consultant Lion Hirth.
The first are “profile costs.” Electricity is demanded in varying
quantities during a day, which plots a time profile of electricity
demand. When generation becomes more variable in response to demand,
costs are greater. If power were demanded at the same rate at all hours
on all days, these costs would be minimal, but as intermittent
renewables grow, the system operator must dispatch a set of generators
that are increasingly difficult to manage for reliability and
efficiency. Second, if power is produced and demanded at different
locations, there are “grid costs” that originate in transmission
constraints (distance and wire capacity). Their abatement can require
investment to strengthen existing links or redesign and rerouting of a
regional network. Finally, there are “balancing costs” associated with
adjustments in dispatchable generator output that must be made to cope
with randomness in renewable generation.
The numerical values of these costs in a particular case will depend on
the details of both generation choices and transmission investment in a
given region. Hirth (2016) summarizes a large literature to estimate
each of the three. Using primarily European data, he estimates that
profile costs of a system with 30 to 40 percent wind penetration are in
the range of 25€ to 35€/MWh (MWh = megawatt hour). He also notes that
when renewables are below 10 percent of the system’s resources, their
profile costs are small relative to generation costs. Despite
often-encountered concerns, balancing costs also depend on the
penetration of intermittent generation and are surprisingly low, from
2€/MWh at low levels to 4€/MWh at high ones. His survey of the research
also shows that grid costs are below 15€/MWh under most operating
conditions.
It should be noted that Hirth’s estimates were gleaned from a large
collection of case studies that are intrinsically difficult to compare.
If, however, the actual costs resemble these estimates, we arrive at a
sobering conclusion: if the average price of electricity is 70€/MWh,
after we net out profile, grid, and balancing costs the net value of
electricity from wind is 35-45€/MWh. This is between 35 and 50 percent below the typical European price, and implies that the optimal
investment in wind resources should be significantly less than the
actual amount. That is, while wind generation receives the market price
for the power it produces, it is actually worth much less because of
the costs it imposes on the grid due to its intermittency. These costs
do not accrue to wind producers, so they over-invest the wind
commodity. The costs and benefits of a particular wind installation may
render it cost-effective, but there is thus far little guidance as to
which non-market characteristics would make it preferable to
conventional generation.
II. Standards for Comparison
A. Which Costs, Which Values?
Everything has a price. Adding up the funds spent to construct, fuel
and operate a power plant yields a dollar total. That total of the
recorded (“booked”) costs, however, may bear no relation to the value
consumers place on its output because the plant is only useful as a
component of a reliable network, which is what consumers actually
value. A kilowatt-hour (KWh) of electricity is worth buying if it
generates more benefits to the consumer than the best alternative he
could have purchased. All electricity consists of electrons flowing
along wires, but like so many economic goods, its value to the buyer
depends on where it is available, when it is available, and the
certainty with which it is available. The cheapest, greenest and most
reliable electricity is worth little to a consumer who cannot access
the transmission line carrying it. The same holds true if it is not
available at midnight or if it is subject to random interruptions that
make it impossible to tell time or to decode the signals sent from a
stoplight.
The disconnect between consumer value and generation cost seems clear,
but it largely escaped electric system planners and utilities for much
of their industry’s history. Even today, they often evaluate a proposed
generator by estimating its “levelized cost of energy.” LCOE is the sum
of capital (generator) costs and operating (e.g., fuel etc.) costs,
discounted over a generator’s expected lifespan, and then annualized.
In an industry dominated by fossil fuels, LCOE was an imperfect but
helpful tool for comparisons.
Fossil-fueled generators were dispatchable, i.e. the grid operator (or
a computer) could order a plant to raise or lower its output and obtain
the expected response almost in real time. If the grid is potentially a
megawatt-hour in deficit, any generator could dependably make up the
shortfall. Before intermittent wind and solar generation, the grid
still faced risks that could bring it down (generation outages from
weather events, for example, that required workarounds) and unavailable
resources (a hydroelectric facility may run out of water). If all
generators are dispatchable, planners must still optimize their mix of
investments in baseload, intermediate, and peaking facilities, but here
too, LCOE is generally a valid standard. With the coming of markets,
some systems now choose new resources using auctions whose effective
standard is LCOE.
B. How Valuable Is Intermittent Power?
Applying the “no free lunch” standard, it is clear that solar and wind
generation add both resources and costs to the grid. The worth
of a “free” megawatt hour generated by wind, however, depends on market
conditions, most importantly the “wholesale” price of power that the
distribution utility pays to generators and recovers from customers.
Reliability is extremely valuable, but intermittent resources can
sometimes degrade it and sometimes enhance it. Solar generators, for
example, produce the most power in mid-afternoon when the sun is high,
coincidentally the same hours that daily demand for power typically
peaks. A cloud that temporarily blocks the sun can reduce production,
but so can an outage at a dispatchable plant. In most regions, wind
strength is not well-matched with load, because wind blows more
strongly and persistently at night. Neither the capital nor operating
cost of a wind unit can by itself determine whether wind beats fossil
fuel generation, and the same may hold for the two taken together.
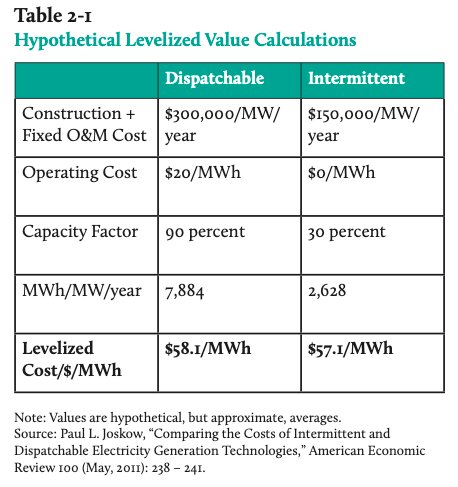
Table 2-1 presents a simple example from Joskow (2011). Its numbers are
“ballpark” approximations to today’s industry figures. Assume a
dispatchable generator with annualized capital and fixed operating
costs of $300,000 per megawatt (MW) per year. Its operating cost is
$20/MWh and its capacity factor is the 90 percent, which roughly
characterizes coal- and gas-fired generators. Capacity factor is the
percentage of hours over the year when it operates at full capacity,
here 7,444 of a possible 8,760 hours. Using these figures, its
levelized cost is $58.10/MWh. The intermittent (wind or solar) plant is
assumed to have only half the annualized capital costs, $150,000 per
MW, and its operating costs are zero thanks to the wind or sun. With a
capacity factor of 30 percent, it can produce 2,628 MWh per year, which
levelizes to $57.10/MWh.
Intermittency reduces the seemingly massive cost advantage of the
renewable plant to nearly zero.
Some sensitivity tests provide additional insight into both generation
and markets. Table 2-2 assumes a market run by a Regional Transmission
Operator into which generators sell their power at time-varying prices.
Column 2 of Table 2-2 shows a dispatchable generator with a 90 percent
capacity factor in a market with an on-peak price of $90/MWh and
off-peak price of $40. For simplicity, off-peak demand is assumed to be
50 percent of on-peak and all outages occur off-peak. Under these
assumptions our fossil-fuel plant approximately breaks even. By
comparison, column 3 depicts an intermittent renewable plant with a
capacity factor of 30 percent. This allows it to operate for 2,628
off-peak hours and zero on-peak. Its revenue per MW per year is
$105,120, which compared with its $150,000 cost, yields a loss of
$44,800 per MW per year. This is an extreme version of a wind generator
that we assume sells nothing on-peak.
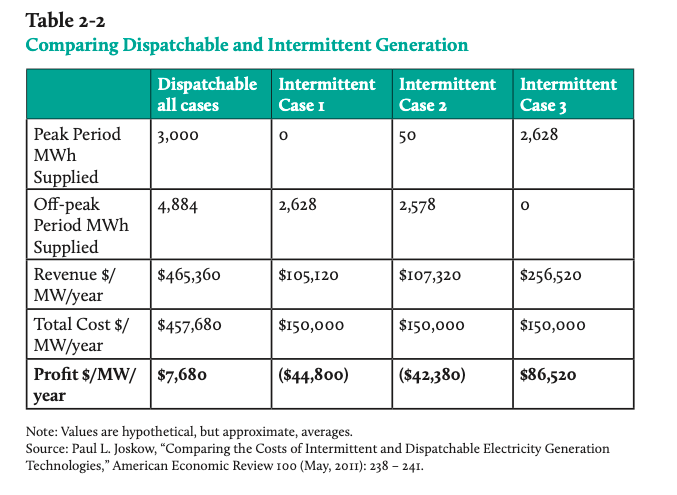
Making a less extreme peak/off-peak assumption has a surprisingly small
effect, shown in column 4 of Table 2-2. Suppose 50 megawatt hours more
were sold in peak hours and 50 fewer sold off-peak. This only slightly
reduces the loss per MWh. Assuming more generation at the peak leaves
the basic result intact. If it generates a somewhat unrealistic 500 MWh
on-peak and 2,128 off-peak (not shown in the table), there is still a
loss per MWh per year of nearly $12,000. Only if the intermittent plant
has the good fortune to run for 1,000 of the 2,628 on-peak hours does
it break even.
The final column in Table 2-2 assumes a solar plant with a capacity
factor of 30 percent that runs only during 2,628 on-peak hours. Solar
is now valuable because it operates disproportionately at peak hours.
Table 2-2 assumes the costs of solar and wind are the same, but even if
the solar capacity costs much more per MWh than wind, it remains the
more profitable investment. The example suggests (but does not prove)
an important point, which depends in part on numerical details:
the utility-scale wind industry will not survive in competitive
power markets unless it is subsidized
.
It is important to note that thus far we have omitted any affirmative
case for policies that grow intermittent generation. Specifically, wind
solar generators do not emit carbon. Some experts believe that climate
problems will soon materialize (others feel differently), and when this
happens they will impose huge economic losses worldwide through a
variety of mechanisms. If so, the harms from fossil-fuel generation
must be factored into the analysis. Examining carbon policies could
change the above outcome in ways that recommend the deployment of
additional intermittent generation. We next turn to this topic.
III. Costs and Benefits of Alternative Investment Decisions
A. Beyond Levelized Costs
Simple LCOE comparisons are inadequate for policy analysis because they
do not consider the full costs of power from different fuels and its
value at different times and places. Newer economic models can
facilitate more complex and inclusive comparisons of generation
investments and explicitly include possible values for the harm from
and the abatement costs of carbon emissions. Largely due to Charles
Frank of the Brookings Institution, these new analyses start from the
investment decision and compare both the values and costs of various
generators.
Treating opportunity costs in more detail, the benefits of a generation
project include its avoided capital costs, avoided operating costs, and
avoided emissions, each relative to some well-defined alternative
generator. We carry along some key items from the previous example
including capacity factors and peak vs. off-peak operation. We also
increase the realism by including backup requirements for intermittent
generators and measures of the harm caused by hydrocarbon emissions. We
take the three major avoided costs in turn and assemble them into a
more complete model. After outlining Frank’s basic method, we go on to
adjust some of his figures in ways that better apply to Oklahoma.
1. Avoided Costs: Emissions
Suppose a megawatt of newly built gas-fired capacity displaces an
equivalent megawatt of capacity from a coal-fired plant. (Standards for
equivalence are discussed later.) The replaced unit no longer emits
pollutants, which we call avoided emissions. Avoided emissions are high
per megawatt when new capacity replaces a baseload coal unit for two
reasons: 1) the coal unit is less fuel efficient than the new one,
requiring more energy (millions of British thermal units, MMBTU) to
produce a MWh, and 2) because coal contains more carbon per MMBTU than
gas. Table 2-3 contains data on emissions from three types of plants
that might be built or replaced. The first is a combined cycle (“CC”)
gas-fired generator, the second is a coal-fired unit (“coal”), and the
third is a single-cycle (“SC”) gas turbine. Each contains data for old
and new plants of that type. Data are from the U.S. Energy Information
Administration for 2013.
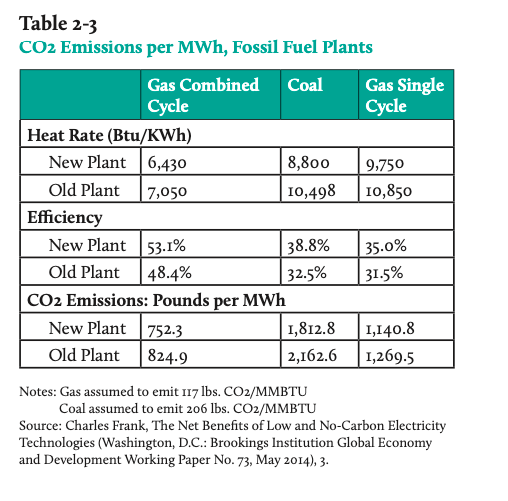
To get emissions per MWh we start from a plant’s heat rate, the BTUs
that are necessary to produce 1 MWh of power (a lower heat rate is
better). Then we adjust it for the plant’s efficiency in turning BTUs
into megawatts, i.e. For a MWh, a new combined cycle gas plant requires
1/.53 = 1.89 MMBTU (million BTUs) times its heat rate, fewer than an
old combined cycle plant that needed 2.07 MMBTU. CO2
emissions per MWh of power produced are for all of the fuel required to
produce it. Gas produces 117 pounds of CO2 per MMBTU and
coal produces 206 pounds.
The efficient choice of generator type depends on costs, capacity
factors, and the characteristics of other power plants. Table 2-4
derives avoided emissions per MW/year (lbs. of CO2) assuming
that the new generator (CC, wind, or solar) displaces coal off-peak and
a single cycle gas turbine on-peak (because this high cost unit is all
that remains after more efficient generators have been committed to
operate. The first line of Table 2-4 provides capacity factors for each
type of plant, averaged over a full year. The table shows a dramatic
difference between intermittent renewables and other types of
generation. Full-year capacity factors for wind and solar are 25.5 and
15.5 percent, while a CC unit has one of 92.0 percent. The typical
photovoltaic generator will operate 15.5 percent of the time, i.e.
1,360 of the 8,760 hours in the year.
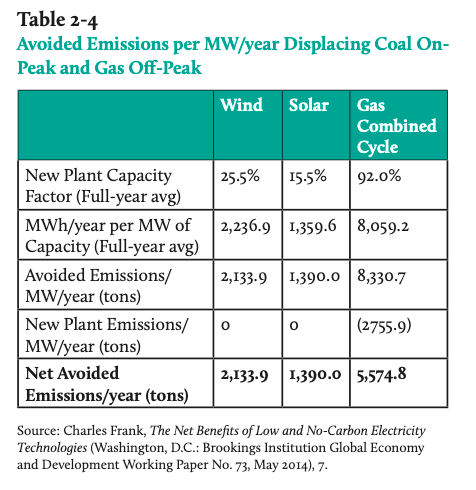
Emissions avoided by installing a megawatt of solar capacity depend on
what it is replacing, which Table 2-4 assumes are coal off-peak and SC
gas on-peak. If it displaces these, the world avoids 1,390 tons of CO 2 per year (calculated from Table 2-3). Whether this is
“good” or “bad” has nothing to do with sunshine being “free,” and
everything to do with the alternatives. Let the alternative be a
megawatt of CC gas capacity. Its capacity factor of 92 percent is
telling us that in 92 percent of all hours, the world is avoiding
emissions from coal (off-peak) and SC gas (on-peak). Idling these units
reduces carbon CO2 emissions over the year by 8,330.7 tons.
But here there is also a cost, because unlike wind or solar, the CC gas
turbine has to emit 2,755.9 tons when doing its job, but still yielding
a net carbon saving of 5,574.8 tons.
2. Avoided Costs: Energy
Table 2-5 calculates avoided energy costs assuming a new unit replaces
coal off-peak and SC on-peak. It then nets them out against the fuel
cost for the new plant. A new 1-megawatt wind plant then allows
avoidance of $74,412 per year in fuel costs, itself a saving because
that plant burns no fuel. A solar unit, with its lower capacity factor,
avoids only $50,938 of yearly fuel expenses. If, instead of the
renewables with low capacity factors, we consider a CC gas unit with a
92 percent capacity factor, we avoid $296,836 per megawatt per year in
costs of the displaced plants. The new unit, however, has its own fuel
costs ($250,737) for a net difference of $46,099 per megawatt per year.
The renewables avoid more energy costs than this fossil-fuel
alternative, but their low capacity factors make for a tighter contest
than one might expect. This example graphically points up the pitfalls
implicit in assertions that energy from the wind or sun is “free” in
any meaningful sense.
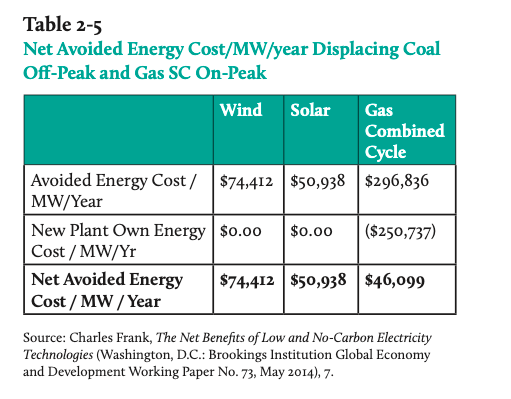
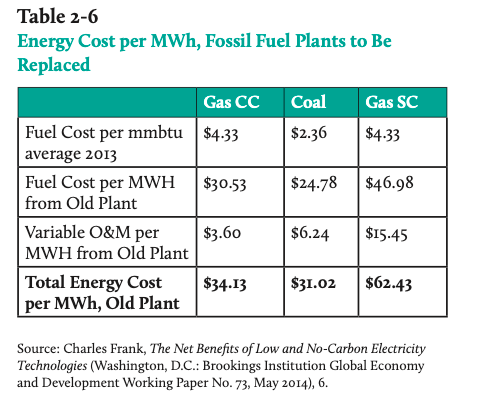
Table 2-6 shows the fuel costs saved (including variable operation and
maintenance expenses) when some type of new generator displaces a CC,
SC, or coal unit. (A plant that replaces a coal unit will have a lower
avoided energy cost than if it replaces a gas generator.) The estimated
values (after accounting for heat rates) are $34.13 per MWh for a CC,
$62.43 for a less efficient SC gas unit, and $31.02 for relatively
cheap coal. All capacity factors are the same as used to calculate
avoided emissions.
3. Avoided Costs: Capacity
Whatever the generator technology, if one megawatt of it is added to
the system, it obviates the need for a one megawatt investment with
similar characteristics. Here, the similarity that matters is equality
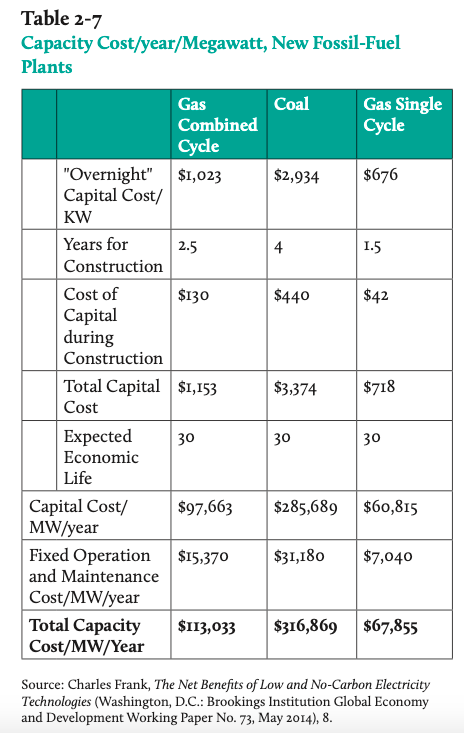
of capacity factors for both plants. Table 2-7 presents the cost of
capacity per megawatt per year for single-cycle, combined-cycle and
coal-fired plants. In addition to immediate expenses on a plant
(“overnight costs”) we must consider the cost of capital during
construction (at 7.5 percent) and fixed operations and maintenance
expenses, and convert them to annualized present values over the
plant’s 30-year lifespan. Overnight costs and capacity costs per year
appear in Table 2-7. A megawatt of combined-cycle capacity is nearly
twice as costly as single-cycle but only 35 percent as costly as a
megawatt of coal capacity.
Now for the tricky part. For a valid economic comparison, we must
adjust the avoided capacity cost of a new 1-megawatt generator to make
it equivalent to the capacity factor of an eliminated plant. Starting
simply, if the replaced plant has a capacity factor of 100 percent and
the new plant’s is 50 percent, two megawatts of new capacity would make
up for losing one megawatt of old capacity. Adding some necessary
complexity, the productivity of a renewable-powered unit also varies
randomly with the inconsistencies of sunlight or wind. Assume that one
megawatt of baseload CC has a capacity factor of 0.9, i.e. it operates
during the 90 percent of hours that it might be wanted. Now let the
alternative be an intermittent renewable plant whose capacity factor is
30 percent. We wish to find the number of intermittent plants
equivalent to a single plant with a capacity factor of 0.9. The answer
is not “3” because in an uncertain world the three taken as a
group will operate at capacity factor of 0.9 only in the unlikely event
that all three of them are running.
Now assume there are four plants, each with a capacity factor of 30
percent. To avoid technical math, we verbalize our quest for equivalent
reliability by asking what percentage of the time we will see at least
three of the four operating. With a “spare” generator we will certainly
see a capacity factor of 0.9 more often than we would without the
spare, but there will still be times when fewer than the desired three
are running. With five generators, failures that leave two or fewer
units operating will be even more rare but still possible.
The math of probabilities allows us to calculate the number of plants
required for the group’s capacity factor to equal or exceed the
replaced plant’s factor of 0.9. Because wind and solar plants have low
capacity factors taken individually, the avoided capacity cost per
megawatt is relatively small. Making the implied corrections,
achievement of a capacity factor of 90 percent in one megawatt of
replacement plant requires the building of 4.28 megawatts of wind
capacity. To duplicate the performance of a 1-megawatt
high-capacity-factor plant requires 7.30 megawatts of solar plants,
whose individual capacity factors are lower than those of wind units.
Small generators with intermittent production will be poor bargains in
this sense, since it takes more capital investment in them to produce a
power source with reliability equivalent to a single plant with a high
capacity factor.
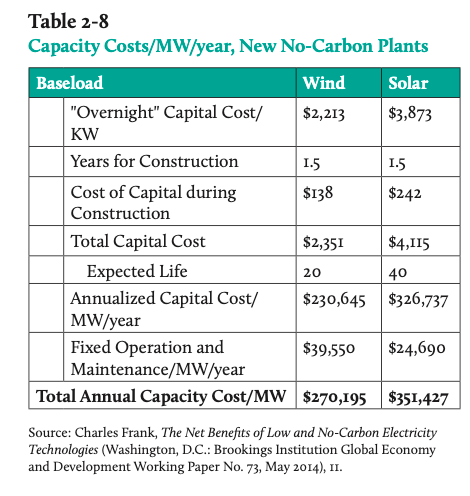
Having estimated capacity costs for combined cycle, single cycle and
coal plants, Table 2-8 shows calculations for one equivalent megawatt
of solar and wind plants that do not burn fuel. Using the same
annualization techniques as for coal and gas units, it shows annual
capacity costs for one equivalent megawatt of wind capacity of $270,195
per year, and $351,427 per year for one equivalent megawatt of solar.
The upper portion of Table 2-9 shows avoided capacity cost if the new
plant (wind, solar, or gas CC) displaces a MW of baseload coal
capacity, after also accounting for differing renewable capacity
factors on- and off-peak. The wind unit eliminates $69,570 MW/year of
coal capacity costs, the solar unit (with its poorer capacity factor)
$45,702, and the combined cycle gas unit (94% capacity factor)
eliminates $323,577 of coal capacity costs. As expected, the lower
portion of Table 2-9 shows avoided capacity cost if the new wind,
solar, or gas CC plant displaces baseload gas CC production off-peak
and gas CC on-peak. Displacing CC gas capacity avoids lower capacity
costs for all three plants, in roughly the same relative proportions as
displacing baseload coal.
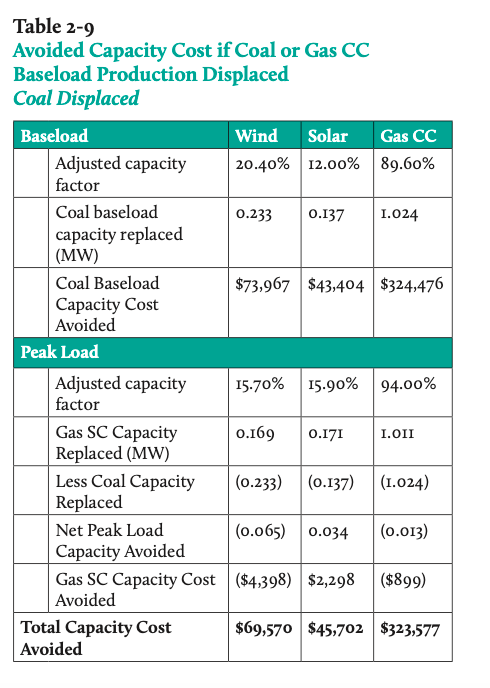
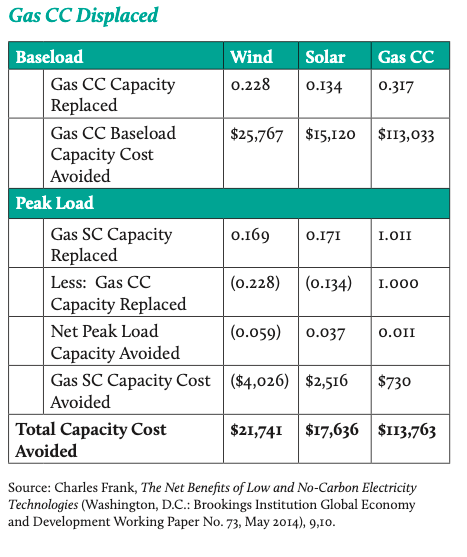
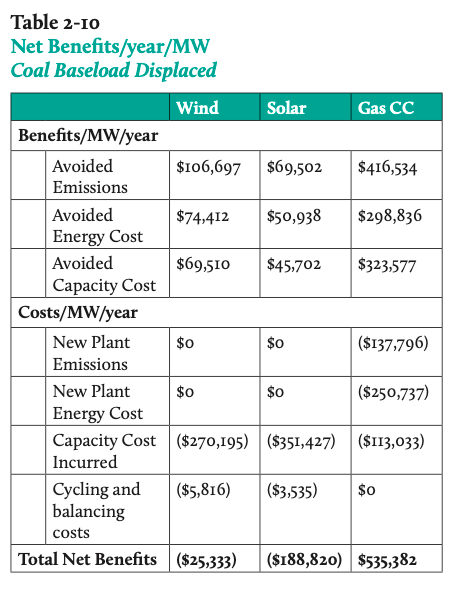
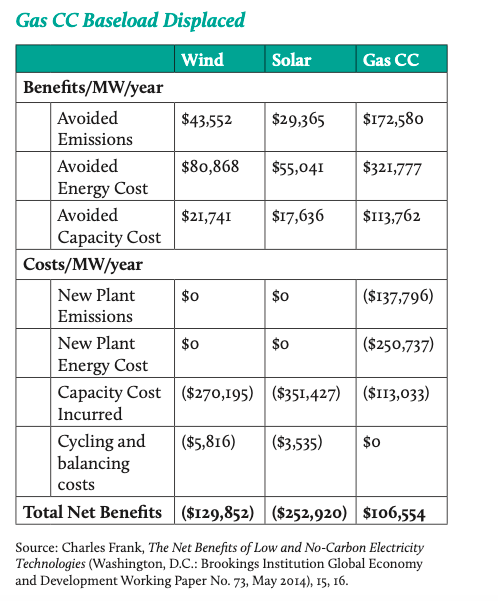
Table 2-10 summarizes all of the above. Its upper portion considers
displacement of one megawatt of baseload coal capacity by a unit of an
equivalent wind, solar or CC gas plant. The benefits are as calculated
above for each technology’s avoided emissions, energy costs and
capacity costs. The wind and solar plants have no emissions or energy
costs, but for completeness we include their relatively low balancing
costs, as discussed above. The annual net benefits if a megawatt of
wind capacity displaces a megawatt of baseload coal are negative but
relatively small (-$25,333), but strikingly negative (-$188,820) if the
alternative investment is a megawatt of solar. The combined-cycle gas
generator easily dominates all of the alternatives. Despite incurring
fuel costs that wind and solar do not, its annual net benefits are
$535,382. The outcome is less sensational on the lower portion of the
table, where the alternative is displacement of combined cycle baseload
gas capacity. Wind and solar become even more inferior with net annual
benefits of – $129,852 and – $252,920. The net value of a combined
cycle plant falls but is still quite positive at $106,654 per MW per
year. An analysis that incorporates more of the relevant opportunity
costs and capacity factors of renewables and conventional generators
yields conclusions quite at variance from those based on simple
levelized energy costs.
IV. Accounting for Carbon
The analysis above appears to weaken any case for policies aimed at
increasing generation from intermittent renewables. It implicitly
provides new reasons for reliance on fossil-fuel generation. Table 2-8
shows the energy and capacity costs avoided by building a solar or wind
plant and the costs for a new CC gas generator, including fuel. These
calculations, however, do not take account of the full cost of a
generator, inclusive of the dollar harm that results from emissions.
Since wind and solar have zero emissions, the question of interest is
to estimate the net benefits lost if we add the emissions costs to the
other costs of a fossil generator. The (negative) value of those
emissions can reflect any environmental degradation caused by
operation. Depending on which harms are considered eligible for
inclusion, their total might be large or small. It is also possible
that the renewables are not blameless. (Should degradation of scenic
views due to wind turbines be included?) Alternatively, we might reason
that harms from pollution are already accounted for because the owner
or customers of the CC gas plant must somehow pay the costs of its
environmental compliance which are largely capital costs. If so, adding
additional damage would be double-counting any harm.
One type of pollution is probably not covered by calculations like
these. Specifically, the accumulation of atmospheric carbon is viewed
by some as harmful over the long term because it induces climate change
whose effects may not be felt until it is too late. If so, the present
value of future harm due to hydrocarbon combustion should be added in.
For several years the federal government has attempted to estimate the
present value of the stream of future harm, which it calls the “social
cost of carbon.” The job is surely a tough one, since it must predict
the dollar values of future harms due to emissions. Even worse it must
account for the fact that the harms (by assumption) will only arrive in
the distant future. Their value today depends on the choice of the rate
at which the world discounts the future, on which economics offers
little advice. At all but the lowest rates, the present value of future
losses due to climate change is negligible. At a five percent discount
rate, the Environmental Protection Agency claims to have estimated the
harm from an emitted ton at $11 for 2015 and $26 in 2050. At a 2.5
percent discount rate the most current corresponding figures were $56
and $95.
In his analysis, Frank attempted to avoid these problems by choosing to
assume (without citations) that “reductions [in carbon emissions] are
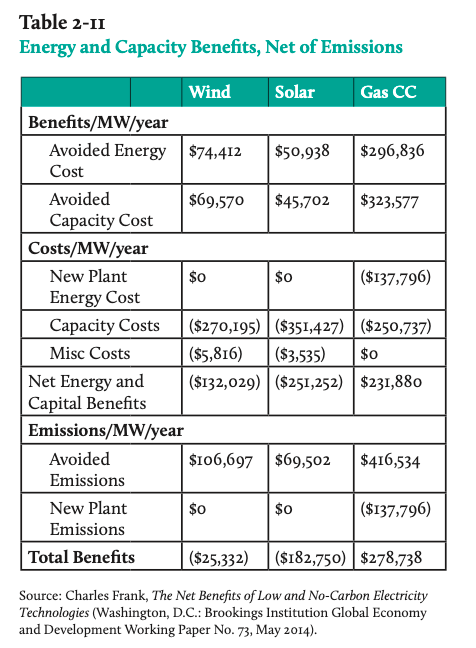
valued at $50 per metric ton.” Table 2-11 adds a row that uses these
estimates to account for the harms incurred and avoided by tolerating
or abating these emissions. Perhaps surprisingly, they do not change
the relative rankings of the fuel-consuming and renewable plants. The
wind turbine, whose net value was formerly a negative $132,000 remains
in the red, but its lack of emissions improves the cost-benefit
calculation to yield only a $25,000 loss. The solar plant’s low
capacity factor also means that it has a low capacity for pollution
abatement. Its net value changes from -$251,000 to -$182,000.
Accounting for carbon emissions obviously impacts the CC plant, but its
net value remains positive, falling from $416,000 not counting
emissions to $278,000 if we do.
V. Conclusions
The wind power industry has attempted to argue that all generators are
subject to interruptions and maintenance.
Other observers have criticized wind power purchase agreements for
factories or data centers by noting that wind doesn’t generate
electricity all of the time. But the reality is no energy source does.
The average wind turbine generates electricity 90 percent of the time,
and modern wind farms often have capacity factors exceeding 40 percent.
That’s close to coal plants and exceeds some types of natural gas
plants. The performance of all power plants can be verified using U.S.
Energy Information Administration (EIA) monthly electricity generation
data that is provided for individual utility-scale power generators.
This reasoning appears convincing in its assertion that the typical
turbine generates 90 percent of the time. A correct statement is that
if wind blew steadily for 90 percent of hours, then wind units would
also have capacity factors of 90 percent. Coal and gas are readily
available and can be inventoried to ensure that the generator can
operate with near-certainty during 90 percent of hours, and wind
cannot.
Raw capacity factors tell us little about wind power in general,
because unless corrected for diurnal and weather patterns they can (and
in Oklahoma, do) entail the operations of generators during hours when
system conditions can render their output valueless. One survey of RTOs
claims to have concluded that on average in the U.S., “each megawatt of
wind capacity can replace about one-quarter megawatt of conventional
generation capacity.” This does, however, vary with underlying
geography and wind conditions. In particular it means that more
clarification is needed before concluding that the recent rise in
Oklahoma’s average turbine output strengthens the case for wind, a
topic discussed at length in the previous chapter. In the next chapter,
we examine the controversy over the capacity equivalence of wind in the
SPP. For the record, however, Frank’s method of calculating resource
equivalence of wind if its capacity factor is 41 percent leaves us with
3.07 one-megawatt wind units rather than the 4.2 that Frank calculated
in his basic case. Note that even with this highly favorable
development the combined-cycle gas generator still wins the competition
with both solar and wind.
Chapter 3
Wind Power for Oklahoma: Benefits Now, Costs Later
I. Introduction
We begin with a basic question: how, if at all, does the addition of
wind power to a grid impact consumers? The response is that, for all
practical purposes, wind power’s cost impact cannot be detected by the
typical user. The peculiarities of Oklahoma and the power industry mask
a complex story that we outline in this chapter. Our first question
will be dollars and cents – What do Oklahoma power users pay in their
bills for wind, and what would they have paid if power from
conventional generators replaced it? We find that wind power’s presence
has hardly affected consumers’ bills, which is why it may seem a
bargain. The maze of subsidies and preferences going to wind producers
has sources elsewhere, so that electricity consumers do not perceive
the increased cost that wind engenders.
We first draw some comparisons between Oklahoma and other states.
Despite the frequency of this approach to regulation, we find them
virtually worthless for understanding the causes and consequences of
Oklahoma’s wind policy. In the process we examine the quality of
comparisons that have been made by others and find them wanting, both
pro and con. Because simple numerical comparisons do not improve our
understanding, we next examine the factors that make them so. One
subset of those factors is regional in nature. Oklahoma does not exist
in isolation, but it is also not part of a homogeneous mass. Rather,
Oklahoma’s energy prices are determined in the markets of the Southwest
Power Pool (SPP) described in Chapter 1. Simplifying, all generators in
the SPP footprint from North Dakota to New Mexico must bid supply
offers into a set of computerized auctions. As is typical in auctions,
the lowest bids are accepted until the amount of power submitted equals
the amount the region is expected to demand. The highest accepted bid
sets the price that will be received by all generators.
Consequently, a wind generator receives the same price per KWh for its
power as a coal-fired unit. There is an advantage in having lower
production costs because the market price will give the efficient
generator more return on investment than an inefficient one, but it
pays any generator to submit a bid as long as its operating costs are
less than the market price. That price is set for the entire SPP
region, and Oklahoma utilities will build these prices into the rates
they charge to households and businesses. State regulation will still
determine the charges for the 50 percent of customer bills that go for
other costs like distribution, operation, and maintenance. Wind units
will have contracted to sell their outputs to local utilities at prices
that were set in the past and are typically fixed for the long term. In
short, the payment for wind-generated power was determined earlier, and
the market price generators receive and utilities (consumers) pay is
set in the SPP. Now comes the paradox: the more wind generators whose
bids are accepted by the SPP, the lower the price of all power
transacted in it will be. But, this is not the end of the story.
Like all such transfer schemes, the tax treatments of wind power have
real economic effects as well as fiscal effects for government (covered
in Chapter 4 and in a separate aside), which are in large part
concealed and whose explicit effects for consumers will be postponed
until the problems become more seriously intractable. Most importantly,
our earlier discussions of capacity factors and intermittent generation
mean that wind is not paying its full cost of participation in the
power market. We consider several studies that have claimed substantial
benefits from adding wind to the grid and find that they have seriously
understated costs, most of which are borne by non-wind generators and
power consumers. That there are costs is clear, but the magnitude of
those costs is uncertain and hard to measure, particularly in the
context of a regional market like SPP.
Adding wind to the region’s resources brings costs, but it also brings
benefits of lower prices to consumers in the region. But over the
longer term all Regional Transmission Operators are encountering
variants of the same problem, picturesquely known as the “missing
money.” In a competitive power market, generators have no regulatory
guarantee of recovering their costs. Their productivity comes in the
form of both power output and system reliability, which are often
inseparable in production. A strong wind presence depresses the prices
that these generators have hitherto expected for the margin of
profitability that makes them worth investing in. In response,
dispatchable intermediate generating capacity is coming into short
supply.
Several RTOs (not yet SPP) have responded to wind’s pricing and
uncertain reliability by devising new rules and new markets whose only
reason for existence is to bypass previous markets in order to support
necessary investments in generators needed to maintain reliability. In
other regions, we are seeing a problem familiar from numerous
interventions originally designed to remedy some seemingly small
departures from “perfect” markets: It is very hard to make even small
interventions without threatening the logic and operation of the entire
grid. Perhaps the ultimate irony of subsidized wind power is that it
could destroy the very markets that were once expected to function more
efficiently because of its presence.
II. Dollars and Cents: Which Comparisons Matter and Which
Comparisons Mislead?
A. Where Power Prices Originate
To understand the consequences of the wind boom we must first
understand who pays for what, and where are the rules that govern. The
first fact that matters is clear from Figure 3-1. Oklahoma has
traditionally enjoyed low power costs thanks to nearby coal and gas. As
noted in Chapter 1, the most significant developments of Oklahoma’s
past 20 years have been a steep decline in the percentage of the
state’s power from coal, and a nearly equivalent rise in wind power,
from zero to 18 percent of the total. Figure 3-1 shows annual average
residential rates per KWh in Oklahoma, Texas and the entire U.S. Since
before 2000, Oklahoma has invariably had lower residential rates than
either Texas or the national average.
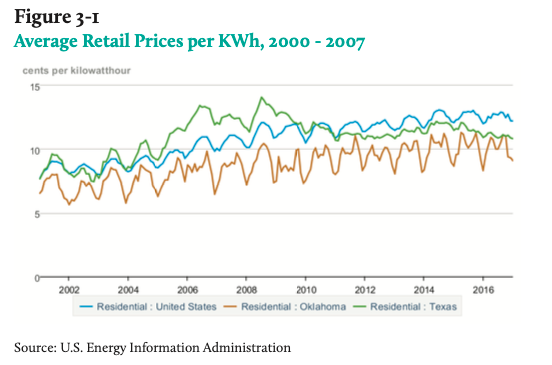
Annual peaks and troughs reflect normal seasonality in the region as
loads peak in summer and early fall. Figure 3-2 points up the
relationship between SPP energy prices (in both the day-ahead and
real-time markets) and gas prices. Gas is most often (not always) the
generator fuel “on the margin,” and the SPP power price tracks its
price quite accurately. Figure 3-2 tells us another fact by omission:
the cost of wind power, however we might measure it, is at best only
randomly related to the SPP market price. If wind power is adversely
affecting Oklahoma, it is not doing so as a result of any direct impact
on prices in the region’s energy markets.
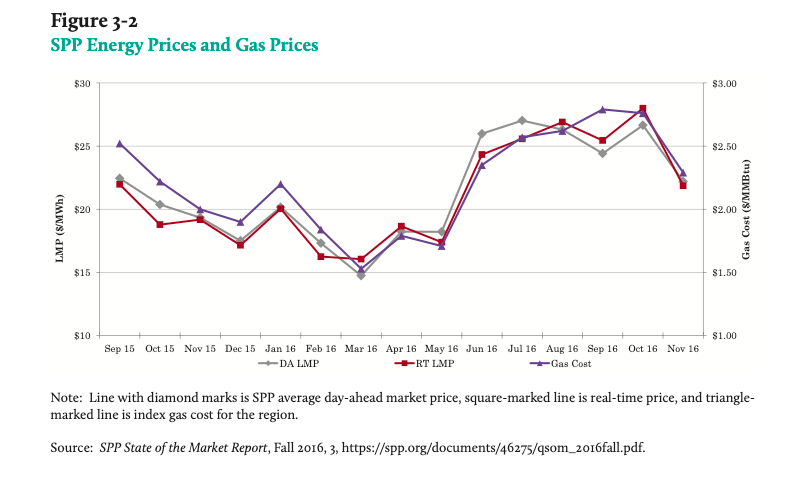 P average day-ahead market price,
Average power prices are of little help in diagnosing Oklahoma’s energy
problems. Nevertheless, average power prices are regularly used on both
sides of the wind argument. A 2014 study by Susan Williams Sloan for
the American Wind Energy Association (AWEA) claims that prices in the
11 states where wind power accounted for over 7 percent of electricity
sales had fallen by nearly 1 percent since 2008. She noted that over
the same interval, prices in the remaining 39 lower-wind states rose
7.8 percent and for the nation as a whole, they were up 3 percent from
2008. Forbes columnist James Taylor claimed that Sloan’s
figures did not match federal data, and that, in fact, nine of Sloan’s
eleven states had experienced “dramatically rising prices.” The
increases ranged from Colorado’s 14 percent to Idaho’s 33 percent, two
otherwise highly dissimilar states – Colorado’s power is largely coal,
and Idaho’s hydroelectric. The rest is an ad hoc explanation –
Taylor claims that Texas’ 19 percent drop is due to deregulation rather
than wind (with no evidence for either) and Oklahoma’s slight drop is
due to its lack of a renewable power quota (but Texas is aggressively
pushing renewables and Oklahoma has already met its legislated goal).
Taylor goes on to say that generation investment in Oklahoma is
determined by market forces rather that state government, a claim worth
examining later.
Neither of these authors bothered trying to put the data through any
statistical exercise, to say nothing of a credibility screen. Further,
one fact may be far more important: power does not stay within the
state where it was generated. Instead, increasing amounts are traded in
competitive markets where all of the region’s power sources compete and
converge to a near-term energy price that (subject to qualifications)
every producer gets. The price of energy in the Southwest Power Pool is
a market price that varies with demand conditions, costs, weather,
random outages and much more. Utility bills may simply be the wrong
vehicles for comparing consumers’ well-being.
The arrival of renewables in both Oklahoma and Texas is undetectable in
these graphs of average prices per KWh to residential customers.
Commonly heard arguments that it is expensive power appear to be at
variance with the price histories of these two of the three most
wind-intensive states. The story of who pays wind power’s cost and how
it happens is complex. Let us first try to see if there is any more
rigorous basis for determining market performance.
B. How the SPP Reduces Costs
Almost every market-driven increase in economic efficiency has, at
base, a simple comparison. Generator owner A has an incremental
(marginal) cost of 5 cents per KWh for fuel and owner B’s plant has a
marginal cost of 7 cents. One cannot tell exactly where any bargaining
might terminate, but “split savings” is a common rule of thumb. If B
pays A 6 cents for a KWh, B may consider it a windfall – power for only
6 cents that would have cost B 7 cents to produce. A may reason that it
has made a shrewd profit as the seller, since A would have sold for any
amount above 5 cents. Our trade has made both parties wealthier (with
greater command over goods) than if they had remained apart and
doggedly pursued “independence.”
Figure 3-3 generalizes and refines this reasoning. It shows the “bid
stack” that normally prevails in the Southwest Power Pool (SPP) market.
Array the generators in order of their marginal costs (“merit order”)
and have them bid for the right to sell power into the SPP. It is a
competitive market (and a closely monitored one) that offers profit to
every generator whose marginal costs are below the market price. That
price is determined by equality of supply and demand, where supply is
the total output of the operating generators and demand is the vertical
line at 50,000 (gigawatt-hours) showing the total power that users wish
to purchase. The diagram was created by Public Service Company of
Oklahoma (PSO) and shows the capacities and marginal costs of most SPP
generators. Those owned by PSO are shown in red.
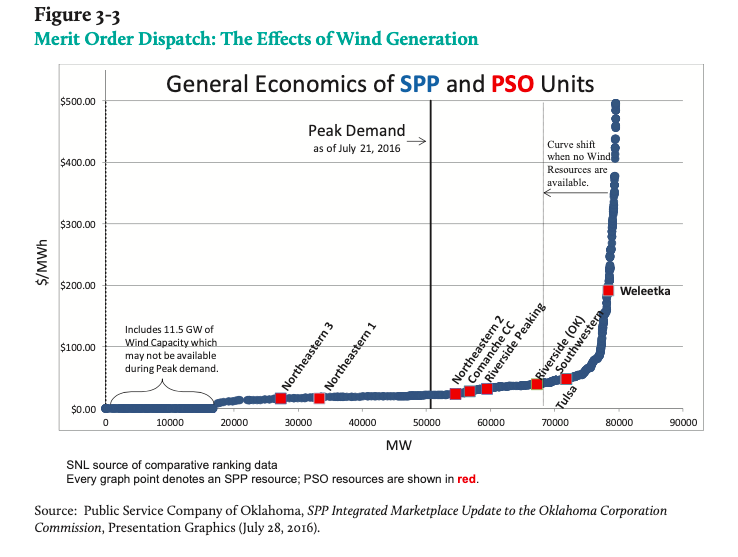
Looking only at PSO, one can see what the company would do if it were
isolated. To the extent possible, it would operate its generators in
order of marginal cost, because doing otherwise would waste valuable
fuel and other resources. If one of its Northeastern units is operable
but not on line while its Southwestern unit is generating, the company
could add to its profit while fulfilling its obligation to serve load
by producing one MWh less in its Southwestern unit and one more in its
Northeastern unit. But PSO might do even better if it could find a
plant with a lower cost than Northeastern and strike a deal with the
alternative to produce the power. The figure already shows a large
number of generators who might trade with each other if aware of their
opportunities. Those trades might necessitate other actions by the
system operator, for example to reconfigure otherwise unrelated
generators so that transmission lines between the two parties are
uncongested.
Prior to mid-2014, today’s SPP footprint was populated by 16 local
interconnections that were responsible for facilitating power
transactions of the types discussed above. Instead of trades within a
footprint that stretched from Montana to Oklahoma, transactions in the
SPP area were largely, but not completely, restricted to limited
localities. Adding more potential buyers and sellers provided
opportunities for both sides to capture more gains from exchange
because the universe of transactions available to them would be larger.
Since the full unification of the SPP grid, a massive number of
cost-saving transactions have materialized. More than simple exchanges,
the most valuable of them entail unit commitments for reliability that
could not formerly flow securely across the smaller control areas of
the past. Even on the scale of the electricity business, these gains
are substantial. SPP was able to reduce online generating capacity (and
thus fuel use) by 10 percent in 2014.
III. Performance and Wealth Transfers in the SPP Integrated Market
A. The Consequences of Economic Dispatch
It is relatively easy to compare the actual transactions and
commitments in the SPP area with those that would have been feasible
prior to the Integrated Market. “The first year of experience with the
[integrated market] yielded savings over the SPP that averaged $660,000
per day or $240 [million] per year.” SPP’s Market Monitoring unit went
on to expect net present value (NPV) benefits of $10 billion over the
next 40 years, relative to NPV costs of $5 billion. Inclusive of
production cost savings, the NPV of all quantified benefits is expected
to exceed $16.6 billion over 40 years, for a benefit-cost ratio of 3.5.
Centralized unit commitment and dispatch alone allowed SPP to reduce
online generating capacity by 10 percent in 2014 and a “somewhat lower
amount” in 2015.
Because SPP’s institutions are still in process of adapting to these
important changes in the operating and market environment the amount of
long-run savings remains unclear, but it is well above zero. All of the
savings discussed here result from reductions in the real resources
that must be used to produce bulk power and maintain reliability. In
particular, they do not include any possible gains to ratepayers and
others that might arise because a greater presence of wind power
reduces market clearing prices for all pool members and their
customers.
At first sight, the effects of adding wind power to a grid like the SPP
should hardly be different from adding any other power source to the
grid. There are, however, difficulties that Figure 3-3 does not touch
upon. Omitted from our earlier discussion were 11.5 gigawatts
(thousands of megawatts) of intermittent generation capacity (mostly
wind and a small amount of solar), whose operating costs are zero.
Assuming that this power is bid into the market, it seems clear that
the grid operator should accept it prior to any bids from any
generators with non-zero marginal costs. Besides producing power at
zero marginal cost, the wind resource confers another benefit on the
grid: with wind generation, the supply curve in Figure 3-3 meets demand
at a lower price and all consumers will enjoy lower energy costs per
KWh.
In Chapter 2 we established that this happy story is seriously
incomplete. Wind’s intermittency implies that voltage and frequency of
the grid can only be maintained if adequate reserves can be instantly
called upon to maintain them. Since reserves are also necessary to
cover the randomness of conventional generation, judging the
desirability of wind power requires comparing its full cost with that
of dispatchable fossil-fuel power.
In particular, the full cost of wind power serving the grid must
include any additional reserves that would not be necessary if wind
power did not exist
. This does not mean that wind power should be rejected out of hand,
because dispatchable fossil-fuel power has its own costs (most
importantly, fuel) that wind power does not.
In Chapter 2 we summarized a large and heterogeneous body of research
that examined and attempted to estimate three costs peculiar to wind
power: “profile costs” necessary to cope with increased randomness in
the time patterns of production and consumption; “grid costs”
associated with transmission that relieves distance constraints; and
“balancing costs” of quickly altering production by dispatchable
generators to maintain voltage and frequency. One survey of research
results (described in Chapter 2) estimated that the total of these
costs for a grid with 30 to 40 percent renewable penetration is in the
range of 35 to 50 percent of the market price. On the other hand, if
intermittent renewables are under 10 percent of a system’s capacity,
they add little to cost because the impact and likelihood of a
renewable resource outage are quantitatively similar to those
associated with a dispatchable one.
B. Application to the SPP Markets
Questions about the true cost and economic value of wind power are hard
to pose and harder to analyze because the numbers are so dependent on
particular situations. Ten megawatts of wind power with a capacity
factor of 35 percent on a 1,000 megawatt grid pose no reliability
problems worth mentioning, but there is some critical percentage of
wind dependency that tilts the balance against it. The rhetoric of wind
power often makes the economics harder to grasp. As typical examples,
consider these excerpts from testimony submitted to the Oklahoma
Corporation Commission by Michael Goggin of The Wind Coalition:
… Adding wind energy to the power system displaces the most expensive,
least efficient, and most volatilely-priced power plants with a
fixed-priced, zero-fuel-cost, zero-emission energy source. … Wind
energy also benefits consumers by … reducing the use of the most
expensive power plants, decreasing the market clearing price for all
electricity purchased in the market. … These impacts are purely market
driven, occurring exclusively because zero-fuel-cost wind energy is
used to displace more expensive forms of energy. …wind energy and other
low fuel cost resources [generally displace] the most expensive power
plants [and] greatly [reduce] fossil fuel energy costs and pollution. …
This “merit order” effect … drives down the market price for all
electricity that is being purchased in the market, not just the wind
electricity.
In reality, adding wind energy to the system does not eliminate price
volatility. It is better described as a way to conceal volatility. The
cost of a dispatchable generator’s fuel supply does vary as gas market
conditions change (and this risk is often hedged by transactions in
derivatives), but standard dispatching procedures can often render its
output reliable at relatively low cost. The wind that fuels a turbine
is highly volatile, capable of switching from full force to zero in
seconds. If sufficient power to restore the grid to its former
condition is unavailable, a wind unit’s failure will bring down a
regional grid as surely as the failure of a gas-fired generator.
To be dependable, a wind unit must have a fuel supply other than wind.
The only difference is that its fuel supply is consumed by reserve
generators that respond to random changes in wind. Adding a wind unit
to the generation fleet reduces total power costs only if it does not
impose net costs on the system (including those of building the wind
generators), such as, if some inefficient generators only exist as
defenses against the randomness of wind. It is also incorrect to argue
that because all power systems require reserves the addition of wind
generation adds few if any extra operating costs.
Below, we note the relationships between on-peak generation by wind and
the reserve requirements imposed by various regional transmission
operators. Intuitively and in fact, wind generators have a higher
probability of going offline than dispatchable fossil-fuel units. There
is at this time no generally accepted method for calculating the
additional risk due to the presence of wind, a question closely tied to
the appropriate reserve percentage that should be attached to it. It
does not suffice, however, to argue that wind should be treated like a
dispatchable source because every power system requires reserves.
Absent countering reasons (e.g. possible harms from unabated pollution)
the grid costs discussed in Chapter 2 may restrict investments in wind,
or tax its availability. One way to discourage additional investment in
wind is to reduce the capacity equivalence of its generation.
The merit order effect is also more complex than may first meet the
eye. Prior to the introduction of wind resources on a large scale, all
generators of importance were fossil-fueled and had high and roughly
similar capacity factors. (Hydro and nuclear are special cases.) Before
the coming of independent power producers in the 1980s and 1990s,
regulated utilities owned almost all important generation. A typical
utility presented the costs of a proposed generator to regulators and
received approval to collect those costs within rates that would be
charged to customers who had no choice but to take service from the
utility. The utility itemized the costs of generators in its rate
application, but its customers saw only that they were required to pay
these costs in the aggregate, for both good and not-so-good generation
investments. The coming of non-utility generators did not change the
basics: they competed to obtain contracts from utilities for generation
that utilities would otherwise have built, but now the generator was
not protected against risk by regulation. Only with the coming of
Regional Transmission Operators would there be significant competition,
in markets that determined generators’ profits or losses (at least for
non-utility generation).
Wind power changes this picture in important ways. In the Southwest
Power Pool and other regional markets, it is “must-take,” i.e. if it
meets the Regional Transmission Operator’s operating standards it has
priority for acceptance in the stack. The wind bids (possibly zero or
negative) are submitted with all others and a market price determined.
Unlike other generators, the financial settlements for wind power are
separate from the SPP price formation process, because they reflect
prices set in pre-existing contracts between wind producers and
utilities.
Wind is hardly a free resource after we consider both the investment
costs in wind turbines and the added costs of maintaining reliability
in a wind-heavy grid. A 2014 study of the SPP by the American Wind
Energy Association estimated massive savings through all of the
cost-saving and merit-order channels. It found that wind reduced the
cost of producing power by $828 million and the cost of wholesale power
purchases by $840 million. The first of these calculations basically
asked what costs (not prices) would have been if the most efficient
uncommitted fossil-fuel generators had been called upon to produce the
output that wind units were producing. The second is the merit order
effect, which takes the difference between market prices (actual value
inclusive of wind) and prices that would have prevailed in the absence
of any wind resources. If any additional operating costs were incurred
in order to manage wind’s intermittency they are not included in the
figures. Of similar importance is the fact that the study assumes that
utilities pay nothing for the wind-generated power, a point that Goggin
admits. In reality, wind generators are linked with utilities by
contracts whose terms contain low prices because the federal Production
Tax Credit subsidizes those low bids, a topic we consider below.
C. Operational Issues in the SPP
The SPP is at the forefront of Regional Transmission Operators in
accommodating wind turbines and other intermittent generators while
paying due attention to reliability issues. The organization
distinguishes between “Dispatchable Variable Energy Resources” (DVER)
and “Nondispatchable Variable Energy Resources” (NDVER). At the end of
2015 DVERs accounted for 46 percent of SPP’s wind capacity and 44
percent of its wind generation. A Dispatchable resource is defined as
one “capable of being incrementally dispatched down by the transmission
provider (i.e. the SPP)” and an NDVER is not. A DVER’s output is under
the control of the system computers, while a NDVER must be explicitly
ordered to cut its output, known as a call for Out of Market Energy.
The controllability of DVERs has helped in congestion management caused
by high levels of wind penetration in the western part (largely
Oklahoma) of the SPP. As of November 2015, SPP wind production was
3,700 GWh (gigawatt hour = 1,000 MWh), with 2,200 GWh from NDVERs.
The increase in manageability of DVERs has substantially reduced
concerns over congestion and allowed higher usable production from
wind. These changes have been complemented by numerous transmission
upgrades that have facilitated increased exports of power from
wind-producing regions, “[c]reating a more integrated system with
higher diversity and greater flexibility in managing high levels of
wind production.” The existing rules are responsible for some
operational problems, most importantly “price chasing” by NDVERs. This
unexpectedly reduces (increases) output in response to lower (higher)
locational prices, triggering transmission congestion and inducing
uneconomic production.
Over the longer run, SPP can achieve additional operating economies,
but its studies emphasize the continued reliance on fossil generators
for meeting unexpected changes in system conditions. In particular, the
substantial numbers of NDVERs in its footprint limit available
ancillary service capacity and requires thermal resources and DVERs to
provide available capacity for ancillary services. The fundamental
problem is that renewables, most importantly NDVERS, impose costs on
the system that are diffused throughout its footprint and included in
general “uplift” payments folded into the charges of all participants.
Other new problems may be on the horizon, regarding compliance with new
North American Electric Reliability Council standards for reactive
power that many wind producers are unaware of or unprepared for.
IV. Looking Ahead
The SPP is in a singular situation regarding its underlying economics.
Average reserve margins over its footprint (as measured by the North
American Electric Reliability Council) are currently slightly below 30
percent, the highest of all RTO regions. The historical reason is that
prior to the SPP Integrated Market, its footprint covered 16 relatively
independent control areas whose abilities to share reserves were
limited. These reserve margins, in part, accounted for the low average
all-in real time energy price of $23.48 per MWh. A 2014 study concluded
that revenues would be insufficient to cover the costs of a coal-fired
plant, a combined-cycle plant, or a combustion turbine, and the
relevant comparison would be even more against building one of these
plants in light of 2015’s nearly-unchanged load and lower prices.
At the same time, investment in wind generation continues strong,
stimulated by the Production Tax Credit and other regulatory
preferences detailed elsewhere. The questions before utilities and
regulators are to determine the regional mixes of resources and market
institutions that are consistent with reliability, and how to induce
continuing resource adequacy. It may not be surprising to find that the
range of opinions is wide, subject to great uncertainty, and,
unfortunately, greatly politicized. The question of interest is one of
equivalence, and the capacity factor estimates from Chapter 2 provide a
numerical basis for determining equivalence between representative
generators. In reality, this is where the argument begins.
Capacity factor is a commonly used criterion but it is specialized to
time and place. If an intermittent source is likely unavailable
on-peak, a capacity factor that simply looks at percentage of all hours
it might operate can seriously mislead. What matters is availability,
which in an integrated grid depends on the overall state of the system
and not just local wind conditions. One expert from the American Wind
Energy Association largely rests his case on the fact that capacity
factors in the southeast (not exclusively Oklahoma) are often from 30
to 40 percent. An environmental witness before the Oklahoma Corporation
Commission begins with the truism that “[a] high capacity factor for a
wind plant indicates that it produces more on average throughout the
year,” which leaves open the question of wind’s contribution at peak
hours. After noting SPP’s determination that Oklahoma Gas &
Electric’s (OG&E) wind resources will receive 5 percent capacity
credit unless otherwise determined, she presents data purporting to
demonstrate that the true credit should be higher.
The issue is critical for both reliability and the future evolution of
wind power in Oklahoma. OG&E rejected wind in its proposal for
compliance with the federal Clean Power Plan on reliability grounds,
noting the Plan’s “absolute requirement that OG&E replace the
capacity provided by the existing coal units with a like amount of
capacity in order to meet its load obligations.” Given that the SPP
recognizes only 5 percent credit for wind generation, “10,000 MW of
wind would be needed to replace just one of OG&E’s 500 MW coal
units.” The general inverse relationship between wind and load
reinforces this reasoning because it too has a substantial random
component. Table 3-1 shows wind’s capacity factor at annual SPP peak
loads in recent years, which range from 5 percent to 34 percent.
Another common comparison is between wind volatility and load
volatility, and in the SPP the former is three times greater than the
latter, a signal that wind induces higher adjustment costs due to its
very presence. The consequences for consumers are discussed in the next
chapter.
Table 3-1: Wind Generation Capacity Factor at SPP for Peak Hours
Note: 2014 – 2015 unavailable
Sources: 2009 – 2013: SPP 2013 State of the Market Report,
34-36.
2016: “SPP notches new peak load records as heat wave strikes region,” Utility Dive, July 26, 2016,
http://www.utilitydive.com/news/spp-notches-new-peak-load-records-as-heat-wave-strikes-region/423254/
.
Chapter 4:
The Bottom Lines
I. Introduction
Thus far, we have determined that the Southwest Power Pool, which
subsumes Oklahoma, is a remarkable economic institution. It organizes
power supplies and demands much like a competitive market and has
proven capable of integrating intermittent generation on an
unprecedented scale while maintaining reliability. It is already clear
that wind generation substantially affects prices by its very presence,
and that the full cost of adding wind generation is not faced by its
owners. In this chapter, we examine the behavior of wind generation in
more detail. Doing so requires delving into the complex subsidy system
that has been the principal impetus for wind’s growth. We first
consider federal policies, whose impact is the largest and most
important. State policies are quantitatively less important, but their
local impacts are more than worthy of further scrutiny.
II. The PTC and Accelerated Depreciation for Wind Facilities
A. Their Provisions
Wind generation competes with other power sources on a less-than-level
playing field as a result of federal (and to a lesser extent, state)
subsidies. The two most important federal subsidies are the Production
Tax Credit and accelerated depreciation for wind facilities. The
ten-year Production Tax Credit (PTC) for wind generators pays
approximately $23 per MWh produced, irrespective of the market value of
the power (including negative prices). Under a 2016 phase-down law, the
credit drops to 80 percent of its value in 2017, 60 percent in 2018 and
40 percent in 2019.
The PTC is quite significant. It is a subsidy to power producers –
generaters – but it is represents a large percentage of the retail price of electricity. In 2015, a megawatt-hour (MWh) of
electricity in Oklahoma cost $79 at the retail level. Thus, the PTC
represents nearly a third of the retail price, and a much higher
percentage of the wholesale price. In Texas, the average wholesale
price of electricity in January, 2017 ranged from about $25 to $35, so
that wind producers, as discussed in Chapter 2, can offer their
production at grossly lower prices compared to other producers.
The Institute for Energy Research has estimated that between 2005 and
2014, subsidies under the PTC and related programs totaled $18.5
billion, of which an estimated $1.09 billion flowed to Oklahoma. By
their estimate, Oklahomans’ share of total taxes spent on the subsidy
was $194 million, leaving the state’s wind power producers, many of
whom are not in Oklahoma, with net benefits of $894 million. Twenty
states, by the Institute for Energy Research’s math, had positive net
effects, and Oklahoma ranked third among them, behind Iowa and Texas.
Accelerated depreciation is determined by federal tax provisions,
amended for wind and some other renewable power sources. Most
technologies are under rules that depreciate them over 20-year
lifespans, but in 1986 wind and some other renewable plants were
allowed to claim 5-year amortization. This change defers tax
liabilities for six years and loads them into the remainder of the
plant’s lifespan, reducing their present value. A representative
calculation lowers net present tax costs for wind by approximately 10
percent.
B. The Economic Effects
These tax preferences help create some seemingly anomalous
characteristics of contracts between wind generators and utilities that
purchase their output. The first anomaly is that, unlike almost any
other power contracts, most wind agreements carry fixed prices for the
contract duration. Contracts for the output of fossil-fuel generators
invariably carry automatic adjustment provisions intended to protect
both their owners and power purchasers from volatility. By contrast,
most wind generators have few variable costs of operation and little
need for such treatment. The second anomaly is that wind generators are
generally paid only for their actual power production. Wind’s
intermittency means that a plant cannot have value as a standby
facility as if it were a fossil-fueled unit that could be called upon
at any time to operate.
Next, Oklahoma graphically demonstrates that the wind power industry is
relatively easy for generation owners to enter. Besides investible
funds, new generation requires construction permitting, which could
entail environmental issues and questions of need for the facility in
states that require such a showing. Wind has an advantage. The typical
wind purchase is competitively negotiated with the transmission-owning
utility in its area. A fossil-fuel generator will only negotiate an
interconnection contract with the utility if it has a reasonable
expectation of recovering its variable costs (usually from sales in the
RTO’s energy markets or under bilateral contracts) and earning a
competitive return on its capital. A wind generator is less constrained
because its breakeven is determined by the subsidies it receives. At
times in some regions a wind generator will compete against others by
offering its power at negative prices, which can be profitable as long
as the price is less than the PTC.
It appears clear that wind’s typical fixed-price power purchase
agreements advantage it as a source, and what arguments have appeared
to the contrary are weak. Supporters have claimed that the
purchase-related distortions are countered by different subsidies that
favor conventional power plants. Comparing the Energy Information
Administration’s estimated subsidies for wind and fossil fuels, the
latter is negligible relative to the former. The Department of Energy’s Wind Technologies Market Report claims that wholesale power
prices do not fully account “for the environmental and social costs of
fossil generation,” disregarding the importance of environmental
controls on fossil plants and costs of integrating wind integration
discussed above. Finally, the report notes that prices in wind power
purchase agreements are generally fixed and known while wholesale power
prices are “short-term and subject to change.” This is an odd
assertion. Long-term fixed-price contracts are rarities in the business
world, because they impede the parties’ abilities to adjust for changes
in risk as market conditions change. In power markets, they are
byproducts of regulatory politics that throws risk on to captive
consumers, rather than tools for prudently adjusting to market
realities.
III. Federal Policies in the Long-run
A. Investment and Markets
The regulatory treatment of wind entails transfers of important
integration costs from investors to household and business power users.
Given the large amount of wind capacity which already must be
accommodated, incremental additions are unlikely to pass cost-benefit
tests. The PTC benefits wind investors and possibly consumers of power
from wind generators, but does so primarily by shifting the subsidy
costs to taxpayers in general. A survey of research on intermittency
costs suggests that an additional wind unit may, in some of today’s
markets, contribute to the grid as little as half the value of the same
dispatchable capacity, and the costs grow disproportionately with
further increases in wind capacity. Therefore, federal subsidies for
wind power are remarkably perverse. Instead of penalizing
intermittency, they reward additional investments in intermittent
generators whose output is of lower value to the market.
Adding significant amounts of wind capacity can also bring inefficient
investment choices by utilities and investors in conventional
generators. Large wind additions may require that the territorial
utility invest in plants designed for cycling to anticipate wind
generation randomness when it would be long-run least-cost from the
standpoint of the system to build baseload capacity that may also burn
a different fuel. History suggests that this has yet to happen in
Oklahoma, and the changes that have come with the SPP Integrated market
may continue to allow postponements and workarounds. There are,
however, newer SPP transmission projects whose major purpose has been
and continues to be decongesting lines in western Oklahoma. As
transmission capacity becomes cheaper to utilize, the additions will
reduce delivered power prices over an important part of the SPP’s
footprint. Transmission additions, however, are multi-functional,
simultaneously able to increase reliability, decrease congestion, and
improve preparedness for future developments. Without more detailed
study of system operations and power supply planning we cannot allocate
the costs to these different uses or isolate dollar values for the
benefits.
B. Constraints on Growth
The SPP has acknowledged a final constraint on wind power: measures to
stabilize voltage that will be costly to implement, increasingly so if
wind continues to grow as a proportion of all generation. In 2009 the
pool’s area (excluding territory added with opening of the Integrated
Market) contained 2,000 megawatts of wind generation. By the end of
2016, almost 17,000 megawatts were online throughout the SPP, with
2,000 more expected to open in 2017. Operating the grid with 60 percent
wind capacity will require substantial investments in voltage support,
which (unlike fossil-fuel plants) wind cannot produce consistently. An
SPP report indicated five major transmission projects that would be
necessary. Recent reports about SPP’s operation with half of its power
generated by wind should not be taken at face value. The system was at
minimum load (prior to 5 AM), and SPP did not release data on ready
fossil-fuel reserve capacity which could have taken over the load in
the event the wind died down.
Another dimension of the long-run investment problem is related to both
capacity equivalence described in the previous chapter and minimizing
the costs of adjustment to wind’s randomness. Specifically, an
individual wind turbine in a region must be operated to mitigate
incessant fluctuations in its output due to wind speed changes. Looking
at a group of generators in an area, it is possible that these small
fluctuations often cancel out. If so, interconnecting the plants and
operating them as a unit may yield substantial savings. The issues
involved include defining the benefits of coordination and comparing
them with the costs.
The most important study in this area examined actual and possible
interconnections within a region of the Electricity Reliability Council
of Texas (ERCOT). There was some good news and some bad. The authors
found, perhaps unsurprisingly, that plants with higher capacity factors
cost less to integrate into a unit, and that most of the average
savings in a 20-plant area ($3.76 per MWh generated) could be achieved
by integrating no more than 8 of them. The less favorable news was that
savings from interconnection fluctuated substantially from year to
year, i.e. the variability cost of a given plant would be high in one
year (relative to the group) and low in the next. Here, however, we
have a policy suggestion: assuming these results are general, increased
interconnections among wind installations would be cost-effective
projects that generation owners would have incentives to build without subsidies.
C. The Effects on SPP Markets
All grids are built to handle most reliability problems thought to be
reasonably probable. When wind first arrived on the SPP footprint, the
grid had capacity and capabilities to handle small volumes of it. SPP’s
abilities can and did grow as its markets evolved. Excess capacity
makes the introductory stage easier. But now, the problems come with
adaptation to further growth in wind, because if the generation and
transmission slack in the grid is gone, adjustments become more costly.
The SPP’s current ongoing grid buildout is in large part a recognition
that wind is here to stay as a power source. Most of that buildout
would probably not have happened absent wind. The funding of
wind-necessitated grid expansions is done by formulas that may not
match the actual costs and benefits to the various parties who incur
the expense.
Wind impacts not only generation and transmission operations, it also
affects energy prices. Here the SPP runs into a deeper problem. Absent
a contract with a utility (whose value also depends on market events
and behavior), a non-utility power producer will usually earn at least
part of its profits and provisions for continuing investments as a
“merchant” generator, whose fortunes depend on the evolution of the SPP
price. Wind generation may now play the role of a bad surprise.
Merchant generators often depend on extreme days for much of their
profitability. Thus, generators in Texas’ ERCOT may bid up to $9,000
per MWh under some system conditions. This occurs very rarely, on days
when power is extremely scarce, but extreme prices may mean the
difference between financial viability and losses for generators.
The coming of wind into the SPP and other RTOs now becomes problematic,
particularly given SPP’s substantial legacy reserves from the days
prior to the Integrated Market. As wind further reduces on-peak prices,
existing fossil-fuel generators (who provide highly reliable power) may
find themselves insolvent. As they do, they may trigger a regulatory
crisis, since regulators cannot simply expropriate their assets to
maintain reliability. As this happens it can only discourage others
from capacity investments they would have ordinarily made.
We are witnessing these events in a number of RTOs, which are adopting
different strategies to resolve the problem. Most have an
administrative exception to market pricing in the form of “must-run”
arrangements. In a typical case, an otherwise uneconomic generator
which must operate to ensure reliability will be put under contracts
that allow cost-based rates that make up the owner’s revenue shortfall.
In reality, these exceptions are complex and may set bad precedents for
other generators who may wish to plead the same sort of hardship.
The risk of future under investment in reliable energy generation has a
straightforward logic. In a competitive market for energy a generator’s
income will be mostly from sales at marginal cost, save in times of
acute shortage. If generators expect markets will only cover their
variable costs but not their fixed costs, they will be understandably
reluctant to invest, which may lead to “boom-or-bust” situations,
credit issues, and unstable prices. Several eastern RTOs have perceived
this problem and have attempted more general strategies in the form of
markets for “installed capacity.”
With an Installed Capacity market, an RTO’s governors (who have their
own financial interests) decide on the volumes and types of new
capacity investments, which will be constructed by auction winners.
These markets for capacity are markets only in a narrow legal sense,
with most competition foreclosed and important resource decisions made
politically rather than by competitive interactions. In practice,
capacity markets protect incomes of inefficient generators by
foreclosing competition from other potential suppliers. As this
happens, market institutions often give way to gaming and end runs
around rules which, not surprisingly, entails the setting of still more
rules. The Pennsylvania-New Jersey-Maryland Interconnection’s capacity
market has thus far transferred 93 percent of its funding to owners of
existing generators and 1.8 percent to investments in new units.
Economists have often opined about the difficulties of planning a
complex economy, allocating its resources efficiently and equitably,
and provisioning it with investments for the future. Tweak one subset
of it, as has been done by regulations that encourage inefficient
development of wind generation, and watch the effects balloon. Wind’s
effects on market prices adversely impact investments in reliability
(conventional power plants), and some new fix will be needed.
The promise of competitive power markets is being lost, and the problem
centers on wind resources that do not pay their way. Economists know
this quite well, in theory and now in practice in the SPP.
As the federal PTC ramps down and, perhaps, is eliminated, and
Oklahoma’s own favorable tax treatment for wind turbines expires, we
will finally begin to see the true economics of wind power take over.
The likelihood is that some windturbines will persist at least as long
as they can be operated without significant component replacement due
to wear and tear. Despite Oklahoma’s unusually persistent (but still
highly uncertain) winds, new investment in wind farms will likely
cease. Some existing wind farms, as they wear out, will cease operating
and be dismantled. A few might persist and be maintained for decades.
This unhappy scenario could radically change if electrical storage
technology were to make a giant leap forward. No one, outside of maybe
a few insiders, anticipated fracking technology and the sea change in
oil and gas production costs it would usher in. Perhaps there is a
technology on the cusp of working that most of us know nothing about.
Another possibility for radically changing the scenario above would be
a climate policy shift even more radical than that represented by the
Obama administration.
Until something like the events just described occur, the true
economics of wind energy simply do not support the current level of
investment in wind power. Instead, investment is driven by government
policy at the federal level, which makes it cost-feasible, and by
states who have mandatory renewable portfolio standards. The growing
consensus seems that wind subsidies are causing problems economically
without helping the environment.
IV. Summing Up Oklahoma State Wind Policy
This paper has shown:
- Today, Oklahomans enjoy the benefits of an excess supply of
electrical energy. There does not appear to be the need for
construction of new generation facilities of any type in the near
future. - Even from the perspective of a believer in climate change, the
environmental benefits from converting all of Oklahoma’s energy
generation to wind is infinitesimal. - The construction of wind turbines in Oklahoma has been driven by
the federal production tax credit, not any Oklahoma state policy.
Despite these facts, Oklahoma has two costly policies in place to
encourage the construction of wind facilities in Oklahoma. These are
the Zero-Emissions Tax Credit and the 5-Year Manufacturers’ Ad Valorem
Tax Exemption. The first is a production tax credit. For every
megawatt-hour produced by a wind farm, the state effectively pays $5 to
the wind generator during its first ten years of operation. In 2014,
this credit cost the State of Oklahoma $58 million in credits for wind
and it is estimated to cost over $88 million in 2016.
The ad valorem (property tax) exemption for wind generators, which cost
the state almost $30 million in 2016, exempts a windmill from property
taxes for its first five years of operation. Since the state does not
tax these wind turbines, it reimburses property-taxing local
governments who must grant the exemption when it is claimed. As of
January 1, 2017, no new wind turbines will be allowed to claim this
exemption, but all wind turbines in operation by the end of 2016 can
claim it.
As of 2016, the two state tax programs in Oklahoma that specifically
benefit wind generation cost the state $118 million. What’s more, the
tax credit for wind is expected to jump to over $130 million in 2017
and then to $253 million in 2018. This last amount alone is over three
percent of the state’s general revenues. The additional difficulties
caused by this foregone revenue are all-the-more acute when one
considers that Oklahoma’s tax privileges for wind do almost nothing to
incentivize greater investment in that industry over and above what the
federal subsidies encourage.
One of the arguments in favor of wind-generation investment subsidies
is that property taxes from wind turbines will contribute to school
funding throughout the state, since the bulk of school district
property tax revenues are rolled into statewide formula funding. These
depreciating assets, with falling property values, have been exempted,
until recently, from property taxes during the five years when they are
most valuable – when they are new. Extrapolating from the cost of the
ad valorem exemption and the amount of megawatt capacity that is
currently in place and exempt from property taxes as well as county
data, it appears that wind generators pay about $6,000 per megawatt of
generation capacity in property taxes. If 2016’s 6,645 megawatts of
wind generation capacity were paying property taxes of $6,000 per
megawatt of capacity, the total would be $40 million, only half of
which would accrue to school formula funding, with rest going to
general state revenue. While $20 million is not a trivial amount of
money, it is a mere one-third of one percent of total spending in
public education.
The total amounts of wind tax credits are significantly larger than the
amount of income tax revenue that wind generators would contribute to
the state if they were not enjoying the credit. This is because the
credits are refundable, which means that the credit can be greater than
the income tax that the credit eliminates. If a kilowatt hour of wind
power is sold in the wholesale market for three cents, there is no way
the wind producer would pay five cents in income tax if the credit did
not exist, but the credit is still five cents and the state pays that
entire amount to the generator as a “refund.” Being extraordinarily
generous, let us suppose that 75 percent of the $88 million in
estimated tax credits for 2016 represent the income tax revenues that
those wind generators would have paid. That means wind generators would
have contributed $66 million to the state’s coffers, not quite one
percent of current state general revenues. Less than half of that would
have accrued to schools.
The bottom line from this analysis is that an argument in favor of
subsidizing wind power in the name of increased revenues for schools is
largely meaningless. A few districts might have benefited a great deal,
especially with respect to contributions to their tax rates to cover
bonded indebtedness. However, if wind turbines were fully paying
property and income taxes now, the most that would accrue to schools
statewide is around $50 million, enough to provide a $1,000 average pay
raise to teachers, but less than one percent of what schools currently
spend. In actuality, wind turbines directly contributed, perhaps, $5
million in property taxes to schools and a trivial amount in income
taxes in 2016. Wind turbines would have likely been built in this state
in response to only the federal production tax credit, the fact of
Oklahoma’s wind, and ready access to the SPP grid. Realizing this, the
ad valorem exemption actually cost school districts $15 million in 2016
in lost tax revenues without attracting wind turbines.
To summarize:
- Oklahoma reached its voluntary renewable portfolio
standard some time ago.
Wind power does not provide environmental benefits to the state.
- Wind power does not provide significant financial resources to K-12
schools. - The Oklahoma Zero-Emissions credit presents significant risk to the
state’s fiscal outlook.
Summary Text HTML
As Oklahoma’s legislature appears poised to end the state’s tax incentive for wind-generated power, arguments continue to be made that wind is good for the state’s electricity consumers as well as for the state’s economy. The strongest arguments to support this claim are that wind, as a form of energy, is free, and that wind power producers often offer their power at a zero or even negative price. But wind’s true economic impact is so blurred by state and federal tax and energy policies that it is nearly impossible for a casual observer to put together an accurate picture of wind’s impact. This paper is an attempt to sharpen the picture with the hope that policy decisions will be improved. The bottom line, however, is stated in Chapter 2, where the analysis strongly suggests that “the utility-scale wind industry will not survive in competitive power markets unless it is subsidized.”
Economists have long shown in a variety of ways, theoretical and empirical, that a free-enterprise system, where government plays only referee and regulator of last resort, yields the greatest possible benefits from mankind’s natural urge to exchange with one another. Active government interference through misguided and excessive regulation, direct subsidies, unequal tax treatments, and generous legal rules only for the privileged, make society poorer than it could otherwise be. Per Bylund, an OSU economist reinforces this point in a separate essay provided in the paper.
Wind Power is currently subsidized through state and federal tax policy. At the state level, new wind producers are effectively paid $5 for every megawatt-hour they produce for ten years. (State tax advantages for wind are discussed in a separate essay within the paper.) This is in addition to the $23 per megawatt-hour the federal government pays these producers for ten years (though the federal subsidy is being phased down). At the wholesale level, the federal subsidy alone is sufficient, under some circumstances, to allow wind producers to pay, rather than receive payment, to load their generated power onto the electrical grid. Properly understood, this economically unsustainable practice alone makes it clear that low prices for wind-generated power, made possible by government interference, obfuscate the real cost wider society is actually paying for that power.
The primary author of this work, economist and energy expert Robert Michaels, shows that wind power is much more costly than it is often thought, although true costs and a real bottom line are difficult to tease out of an extremely complex electric generation and transmission environment. Michaels’ argument can be summed up as follows. Once a basic, but thorough, understanding is gained of how modern electrical grids work and how important it is that energy sources be highly reliable, it becomes clear that wind-generated power has little, if any, cost advantage over other power sources, despite appearances to the contrary. What’s more, the main advantage wind has, which is to reduce carbon emissions, is not clear at all, given wind’s intermittent nature and the need for fossil-fuel backup power plants. This last point is reinforced by an essay included in the paper from climate expert, Paul Knappenberger.
This paper shows that:
- Today, Oklahomans enjoy the benefits of an excess supply of electrical energy. There does not appear to be the need for construction of new generation facilities of any type in the near future.
- The construction of wind turbines in Oklahoma has been driven by the federal production tax credit, not any Oklahoma state policy.
- Oklahoma reached its voluntary renewable portfolio standard some time ago.
- Wind power does not provide environmental benefits to the state.
- Wind power does not provide significant financial resources to K-12 schools.
- The Oklahoma Zero-Emissions credit presents significant risk to the state’s fiscal outlook.
Chapter 1 provides an overview of electric power in the United States and Oklahoma. It describes how the mix of electrical power sources has changed over time, as well as the regulatory and legal frameworks within which power generators operate. It also points out that there are laws of nature that must be taken into account in order to maintain a stable electrical grid that reliably provides power. Part of what makes this possible for Oklahoma is the Southwest Power Pool (SPP), a large, multi-state electrical network of which Oklahoma is only a part, which is described. Finally, a basic explanation is provided of how power flows within the SPP, and how it is that this somewhat artificial but remarkable market, with its many mandates and regulators, insulates us from some of wind power’s worst potential effects.
In Chapter 2, Dr. Michaels explores whether wind power is actually economically valuable, given its intermittency (i.e., that the wind does not blow steadily 100 percent of the time), using methodology developed by a Brookings Institution economist. The fact is that a wind plant rated to produce a given maximum amount of electricity can only be counted on to produce a fraction of that amount over time. Even that fraction, however, cannot be reliably expected to be delivered as needed. This is because wind, even that as seemingly reliable as Oklahoma’s, is not reliable enough as a source of power to produce the constant voltage needed on a modern electrical grid. Wind cannot reliably be nearly instantly called up to cover unexpected loads, grid interruptions, or unexpected power interruptions from other generators. Yet, because of the far-flung nature of the SPP and the ability of that market to accept nearly any power source that bids low enough and is willing to pay to be admitted onto the grid, wind has been integrated into the system. Nevertheless, this has happened at a cost as the SPP has had to create a special side market to keep subsidized wind’s artificially low prices from destabilizing the grid. What’s more, Dr. Michaels shows that when wind replaces older fossil-fuel generation, it often does not produce the value (in reduced fuel and capital costs) or even the reduction in CO2 emissions that more modern fossil fuel technologies often accomplish since wind does not always blow and reserve generation must therefore be maintained.
In Chapter 3, the fact that wind might have helped to lower electricity prices in Oklahoma is acknowledged, but only a short-sighted, short-term basis. It is also argued that there is a hidden cost to these lower rates. As already noted in Chapter 2, much of this cost is in reserve generation, not to mention the impact on Oklahoma’s tax revenue picture. There has also been a large investment in new grid extensions and upgrades of the current SPP grid, partly to accommodate wind. Wind’s low prices are, in no small part, made artificially possible by mainly federal, and to a much smaller degree, state tax subsidies. Ultimately, given that SPP gives wind generation only 5 percent credit as part of its reserves that can be called up when needed, it would take 10,000 megawatts of wind generation to replace only 500 megawatts of, say, coal units. Wind can only be absorbed as a generator up to a very limited point. In fact, Chapter 4 argues that given the costs of its absorption and the federal subsidies wind has received, it is arguable that the future of wind is higher costs, not lower, for consumers. At best, wind power has made a very limited contribution to property tax revenues and is not likely to make a large contribution in the future, but presents a significant risk to Oklahoma’s future state revenue outlook.