Teacher Pay: Facts to Consider

Authors
Baylee Butler and Byron Schlomach
Abstract
This paper breaks down facts about Oklahoma’s average teacher salary, considers how benefits might change generally-accepted teacher pay comparisons across states, cost of living, and inflation adjustments. Historical comparisons are also made, along with a discussion of facts regarding comparisons with other professions so that information on the issue is as full and accurate as possible.
Full Text HTML
Teacher Pay: Facts to Consider
Baylee Butler and Byron Schlomach
Even with the failure of Oklahoma’s State Question 779 last November by almost 19 percentage points (59.4 percent against to 40.6 percent in favor), the subject of a pay raise for teachers is very much alive in the legislature.[1] Believing that significant public support for teacher pay raises persists, at least ten bills addressing the issue were submitted by legislators.[2] This is motivated by claims of a teacher shortage in the state, that Oklahoma’s teachers are poorly paid compared to neighboring states, and complaints that salaries have failed to keep up with inflation. All these assertions, however, should be tested against the evidence.
What Teachers Are Paid
The latest federal statistics on teacher salaries that allow comparisons across states come from the National Center for Education Statistics (NCES) for the 2015-16 school year. These indicate that Oklahoma’s average teacher salary is $44,921. Teachers are contracted for 181 days of school service, but also receive sick and personal day allowances, so they do not have to actually show up for all 181 days.[3]
Teacher school days vary from district to district, but a seven-period day is seven hours long for students. Teachers generally must show up ahead of the official start of the day, usually about a half hour. Typically, teachers receive one work period and they are allowed a duty-free lunch. Thus, required time in teaching and preparation at school is 7½ hours. Many teachers are out the door when the last bell rings, but most likely stay at least a half hour. Others have extra duties, for which they are often compensated, sponsoring extra-curricular activities. Coaches have longer days as well, but are compensated. Say, on average, all this adds another 1½ hours to the typical workday, so that a teacher typically works a 45-hour workweek.
Now, let us give the benefit of any doubt and assume that a typical teacher’s own preparations completely outside of contracted days takes up another 40-hour workweek for a total of 186 days. All told, this amounts to an hourly rate of $26.83. This rate of pay, however, does not include the value of benefits. When benefits are included, pay increases considerably, by about 47 percent, or $21,113 for a total average cost per teacher of $66,034.[4] This takes average hourly teacher pay to $39.45.
To be sure, the numbers shown here are averages. Some teachers, by the nature of their subject matter, the students they teach, the demands of their supervisors, and their own consciences, put in considerably more time than is illustrated here. On the other hand, there are a number of teachers who put in the very minimum possible. Some teachers who put in a good deal of time and are highly effective are paid well below the average hourly pay illustrated above. Some who put in the minimum of time are paid well above that average. However, most of the discussion and evidence regarding teacher pay in Oklahoma surrounds averages, so that is what is illustrated here.
Recent Trends in Teacher Pay
Just after the national Great Recession (2007-2009), in 2010, the nation’s inflation-adjusted teacher salary reached its all-time peak. So did Oklahoma’s. (See Figures 1 and 2, below.) Teachers’ salaries were buoyed by President Obama’s anti-recession program, which pumped federal dollars into public education and were evidently substantially used to increase teacher salaries. Thus, teachers were insulated from the early impact of the Great Recession. Since then, the inflation-adjusted average salary for Oklahoma teachers has fallen some $7,500 in 2016 dollars. About $4,500 of this drop can be attributed purely to salaries failing to keep up with inflation.[5] Part of the decrease might be attributed to younger teachers, given the school-age population increase the state has seen, as well as school administrators’ reactions to budget cuts.
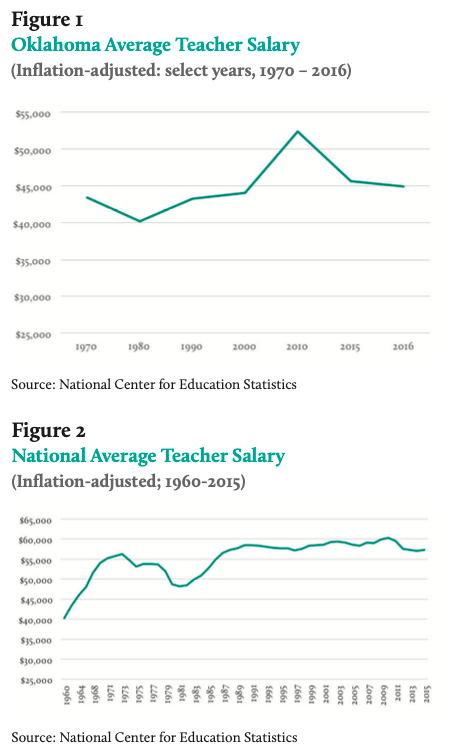
Despite the drop in average salary in recent years, Oklahoma’s teachers are still earning an average of $13,600 more in 2000 than in 2016, which is also almost $1,000 more after adjustment for inflation.[6] This is because Oklahoma’s average teacher salary in 2010 was quite high, historically and relative to other states.
In 2010, after adjusting for cost of living, Oklahoma had the 14th-highest average teacher salary in the nation, immediately behind Texas, whose average was only $80 higher in purchasing power.[7] Total pay for teachers in Oklahoma, taking benefits into account, was likely much higher than in Texas, given Oklahoma’s relatively generous benefits.[8] Proposed pay raises pending before the legislature would ultimately bring Oklahoma teacher pay either back on par with the pre-recession salary average or exceed it.
Nationally, the rate of increase in the inflation-adjusted national average annual salary for teachers slowed around 1990, long before the Great Recession’s onset (see Figure 2). The peak in teacher salary occurred during the 2009-10 school year, the final year federal funding helped to significantly offset the recession’s impact on public education. In 2011-12, there was a marked decline in the average annual salary, and an even bigger drop the next year. As measured by the national average, teacher salaries have only begun to recover.
Regarding the long-term trend, Oklahoma’s inflation-adjusted average teacher salary has actually outperformed the nation’s average. Figure 1 shows that Oklahoma’s average teacher salary has fallen, but only to the long-term trend, which is almost flat. Figure 2 shows that the national average has yet to recover to the long-term trend.
Despite the lack of full recovery nationally, teachers have, on the whole, done as well or better than Americans in general. Changes in the inflation-adjusted national average teacher salary stack up favorably when compared to changes in average inflation-adjusted household median income in the last 20 years. Household median income reached its peak way back in 1999. After the Great Recession, it reached a low last seen in 1995.[9]
Overall, teachers have seen less volatility in their incomes than have most Americans. They have also seen less volatility in their health insurance and retirement benefits. Most corporations have moved away from pension systems, which most teachers still enjoy, despite the financial trouble in which many pension systems find themselves. Teachers and government employees in general have not suffered the same level of upheaval that Obamacare has caused for privately-provided health insurance, either.
Oklahoma Teacher Pay Compared to Other States
State-to-state comparisons of total teacher compensation, including benefits, are difficult to make due to how funds for benefits are accounted for from one state to another. In national statistics, most of Oklahoma’s expenditures on teacher health insurance are not included. National statistics on education expenditures are aggregated from district-level expenditures, regardless of the source of funds. However, federal statistics fail to account for education-related spending where states make expenditures that are part of total spending on public education. In Oklahoma’s case, most of the spending on teacher health insurance is appropriated directly at the state level and is not reflected in district accounts, so this expense is not counted in federal statistics. The same is true, to some extent, of retirement benefits.
Federal statistics show that total benefits expenses as a percentage of total salaries in instruction are much lower for Texas than any other state, and half that of Oklahoma.[10] On the one hand, Oklahoma’s teacher health insurance expenses, financed by the state and not districts, are not recognized by federal statistics, but retirement costs, which are paid by districts, largely are. On the other hand, Texas’ retirement expenses, paid by the state, are not reflected in the federal numbers, but health insurance expenses, paid by districts are. Given the offsets in each state’s accounting at the federal level, the federal statistic clearly shows that Texas offers teachers benefits of much lower value than Oklahoma. How states might rank on a salary plus benefits comparison, overall, is a matter of speculation since the state/district splits would have to be known for every state with some precision.
Another issue that impacts relative positions of states in a ranking of average teacher pay (salary plus benefits) has to do with recognizing and fully paying the costs of teacher pension funds. Many states understate the full liability of pension funds and, in so doing, are paying too little into the funds. Eventually, this cost will have to be recognized and paid, but in the meantime, the practice of underfunding has the effect of understating benefits. Oklahoma is one such state that is guilty of understating how much teachers are effectively being compensated in this way.[11]
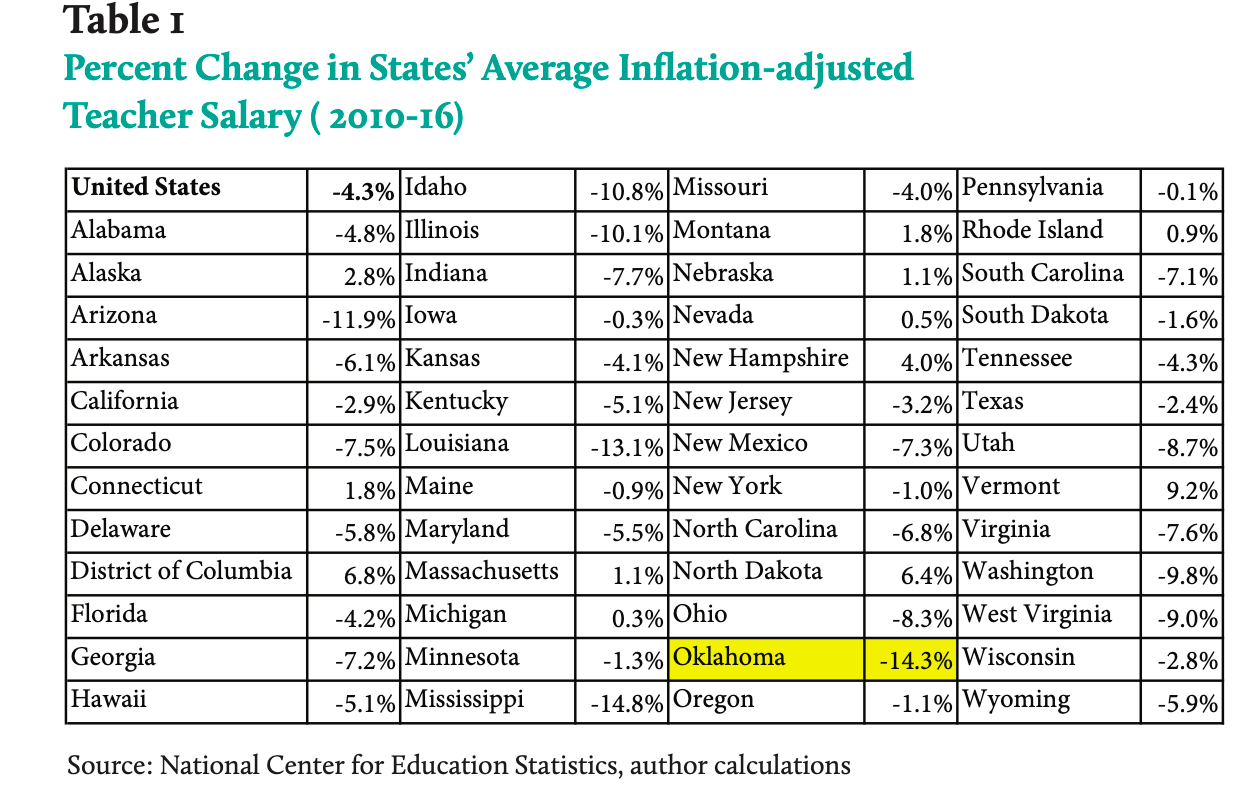
Despite the greater income stability teachers have generally enjoyed, Oklahoma’s inflation-adjusted average teacher salary (which does not include the value of benefits), following a pattern similar to that of the United States as a whole, has definitely seen a bigger drop than most states since 2010. Thirty-nine states’ average teacher salaries have fallen from 2010 to 2016, as shown in Table 1. However, Oklahoma’s teachers have lost more purchasing power, on average, than any other state except Mississippi. One reason for this big relative drop is that Oklahoma’s average teacher salary was so high in 2010, historically and relative to other states. Part of Oklahoma’s large decline shown in Table 1 was just falling back to average, considering the state’s low cost of living.
While it is widely and correctly reported that Oklahoma’s average teacher salary ranks nearly at the bottom compared to other states, this fails to take account of Oklahoma’s relatively low cost of living. Where Oklahoma’s average teacher salary ranks 48th in the latest National Center for Education Statistics (NCES) data, adjusting for cost of living moves Oklahoma to 30th, as can be seen in Table 2.
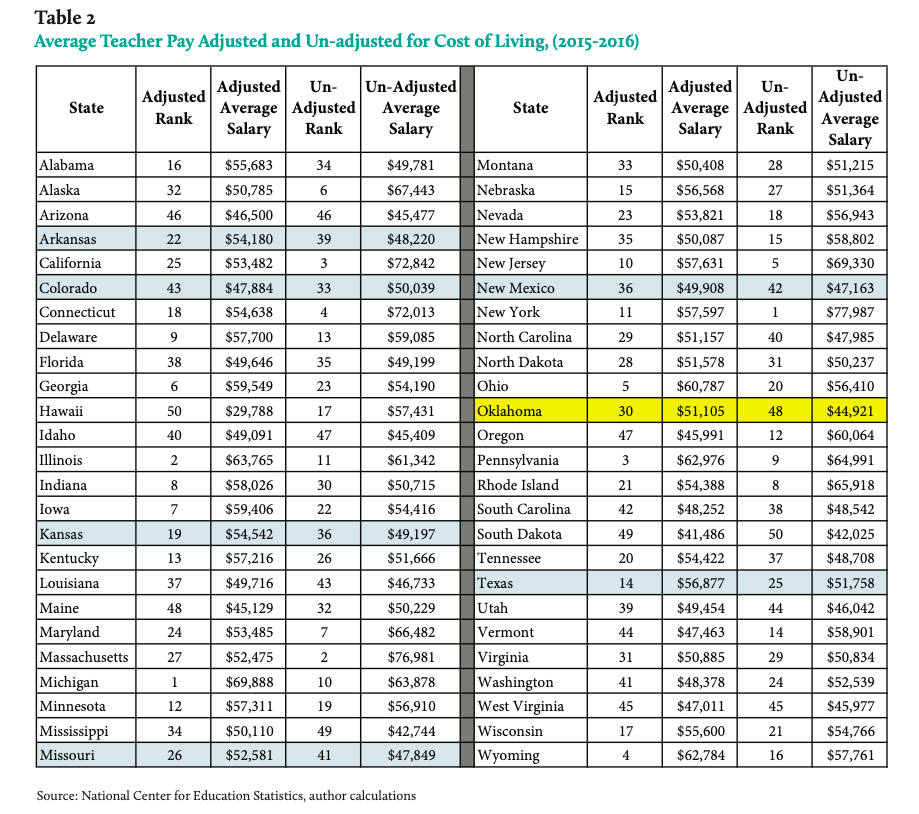
Oklahoma’s current and past cost-of-living-adjusted ranking in average teacher salaries shows two things. First, Oklahoma’s average teacher salary has lost ground compared to the same statistic in other states, falling from 14th in 2010 to 30th in 2016. Second, Oklahoma’s current ranking would likely be lower had the state not ranked so high in 2010. Oklahoma’s teachers have suffered a drop in relative pay since 2010, but their average pay is still only five positions from the median (30th versus 25th) among the states on a cost-of-living basis.
Texas’ highest-teacher-salary status among Oklahoma’s neighbors partly reflects a decision made there to pay in wages instead of benefits and, in a sense, overstate the pay of Texas teachers when only salaries are compared. While some school districts in Texas might offer benefits on par with those of Oklahoma, most clearly do not, given that Texas’ reported benefits as a percentage salary are so low.[12] To the limited extent Oklahoma’s teachers have moved to Texas to chase higher salaries, they have likely been disappointed by the benefits.
Teacher Compensation Compared to Other Professions
In a comparison of educators to similar professionals, the Cato Institute’s, Neal McCluskey has presented data from the Bureau of Labor Statistics (BLS) showing teacher earnings in Oklahoma were above the state’s average annual earnings for all occupations in 2009.[13] Additionally, McCluskey pointed out teachers earned about 11 percent more than similar professionals with pay computed as an hourly wage. Teachers commonly respond that they often work outside of the school day grading assignments or preparing lessons. McCluskey countered this by pointing to a study which indicated teachers average eighteen fewer minutes worked per day than their counterparts.[14]
In a research paper for the Heritage Foundation, Jason Richwine and Andrew Biggs show that “[w]orkers who switch from non-teaching jobs to teaching jobs receive a wage increase of roughly 9 percent. Teachers who change to non-teaching jobs, on the other hand, see their wages decrease by roughly 3 percent. This is the opposite of what one would expect if teachers were underpaid.” To add to the comparison, studies have shown that, by field of study, students earning their degree in Education average the lowest scores on college entrance exams. This serves to illustrate that on the basis of skills, experience, and education, teachers are financially better off as teachers than if they sought work in another area.[15]
When considering if teachers are underpaid, it is important to factor in other perks of the job. Teaching is unique in that substitute teachers are on standby in case a teacher has an emergency or needs to take a sick day. It is a particularly appealing profession for men and women with families as it allows them to have the same schedule and holiday breaks as their children. In terms of earning potential, having a substantial break each summer provides an opportunity to take on a temporary job for additional income.
The Condition of Oklahoma’s Market for Teachers
Supposedly due to inadequate pay, an alleged teacher shortage has become a big issue in Oklahoma, but at best, the evidence for such a claim is sketchy and anecdotal. A study chiefly commissioned by the Oklahoma Regents for Higher Education, and conducted by the American Institutes for Research (AIR), shows a future statewide teacher shortage amounting to a functionally trivial 0.62 percent.
Anecdotes common in the press about teachers moving to Texas fail to prove a trend. There are also anecdotes, not so common in the press, of fully certified teachers having difficulty finding a teaching position in Oklahoma, which indicates a surplus of teachers. The national unemployment rate for all classes of educators is currently 2.9 percent, higher than the 2007 rate of 2.4 percent, indicating a national surplus. An AIR researcher has pointed out the difficulty of identifying the actual potential teacher supply in any state, as well as the reasons, such as issues with classroom discipline, that certified teachers choose not to participate in the teacher market.
Stories sensationalizing the rising number of “emergency” certifications in Oklahoma are commonly cited as evidence of a teacher shortage and the need for a salary increase in the state. However, an emergency certification requires administrators to identify an individual as potentially qualified, a district superintendent to write a letter in support, and the potential candidate to have either passed, or be signed up to take, a nationally-recognized subject knowledge exam.
So-called emergency certification is less an emergency than simply an alternative. It is not uncommon for an emergency certified teacher to be fully certified, either in another subject in Oklahoma, or in the same subject in another state. Through an exhaustive investigation of almost 2,200 emergency certifications granted from January 2015 through September 2016, it was found that:
- In 2016, only 2.1 percent of all Oklahoma teachers were emergency certified,
- The bulk of emergency certified candidates had college degrees appropriate to the subject matter they were to teach,
- Many emergency certified had master’s degrees; several had PhDs; two had MDs,
- Only three school districts – Oklahoma City, Tulsa, and Putnam City – represented 39 percent of the state’s emergency certification requests, but had only 19 percent of the state’s students,
- Forty-one percent of emergency certifications were for elementary education and early childhood,
- Only 9.4 percent of emergency certifications were in Biology, Chemistry, Earth Science, and Science, combined,
- There were no emergency certifications for Special Education, and
- In Advanced Math, Biology, Chemistry, Early Childhood, English, and Science, 70 percent of emergency certification candidates had strongly subject-related college degrees.[16]
Finally, data from 2009 show that only 70.6 percent of Education degree recipients were employed full-time (in any field, not just education) one year after graduation. This indicates that nearly one-third of students graduating with degrees in Education were having trouble finding employment during a period of still-high demand.[17] This indicates a tendency in the education world toward a surplus of teachers, rather than a shortage. Emergency certifications in Oklahoma might be an indication of just how willing new teachers desperate for a job are to locate where jobs are available.
Given the state of objective information available, Oklahoma has, at worst, a teacher shortage trivial in size. It may actually have a surplus.
Conclusion
Some of the studies cited and summarized in this paper are national in scope and, therefore, do not precisely coincide with Oklahoma’s teacher salary situation. However, Oklahoma follows the national pattern. That is, in general, when teachers’ salaries are compared to those of other professionals, teachers fare well. When recognized benefits are included, Oklahoma teachers are paid nearly $42 an hour. But this is understated when one recognizes that the value of retirement benefits are not fully recognized or funded in Oklahoma.
Popular comparisons of teacher salaries across states fail to take account of cost of living, and when cost of living is taken into account, Oklahoma’s average teacher pay compares well. Even though it is undeniable that the state’s average has lost ground since 2010, the fact is Oklahoma’s teachers were very well paid that year and a drop in position relative to other states was almost inevitable, even if Oklahoma had not been wracked by state recessions since that time.
Finally, claims of a teacher shortage as justification for a substantial across-the-board salary increase are often over-stated and might just be altogether wrong. The best evidence of a true teacher shortage in Oklahoma is that its size is trivial, and given the state of the evidence, there could even be a surplus of teachers, and there almost certainly is in some subject areas.
________________________
- “Oklahoma One Percent Sales Tax, State Question 779 (2016),” website, Ballotpedia, accessed March 7, 2017, https://ballotpedia.org/Oklahoma_One_Percent_Sales_Tax,_State_Question_779_(2016). ↑
- Codutti, Anna, “What Your Legislators Think Is Important: Teacher Raises, State Astronomical Object and School Uniforms for All,” Tulsa World, February 6, 2017, accessed March 3, 2017, http://www.tulsaworld.com/news/state/what-your-legislators-think-is-important-teacher-raises-state-astronomical/article_514b2558-a2b4-58e2-9535-c6e78f7e4a31.html.↑
- This assumes the Oklahoma City School District’s teacher contract is typical. Collective Bargaining Agreement 2016-2017 Between the Board of Education of Independent School District Number 89 of Oklahoma County, Oklahoma and the Oklahoma City AFT Local 2309 of The American Federation of Teachers AFL-CIO of Oklahoma City, Oklahoma, 17, access March 16, 2017, http://www.okcps.org/cms/lib011/OK01913268/Centricity/Domain/110/2016-2017%20Teachers%20CBA%20WEB.pdf. ↑
- Author calculations based on Digest of Education Statistics, National Center for Education Statistics, Table 236.5, https://nces.ed.gov/programs/digest/d15/tables/dt15_236.50.asp, and Oklahoma School Finance: Technical Assistance Document (Oklahoma City:State Department of Education, 2014). ↑
- See Digest of Education Statistics, National Center for Education Statistics, Table 211.6, https://nces.ed.gov/programs/digest/d16/tables/dt16_211.60.asp?current=yes. ↑
- See Digest of Education Statistics, National Center for Education Statistics, Table 211.6, https://nces.ed.gov/programs/digest/d16/tables/dt16_211.60.asp?current=yes. ↑
- Author calculations using Digest of Education Statistics, National Center for Education Statistics, Table 211.6, https://nces.ed.gov/programs/digest/d16/tables/dt16_211.60.asp?current=yes and cost of living index data from Missouri Economic Research & Information Center. ↑
- Oklahoma’s total instructional benefits as a percentage of salaries in 2012-13 was twice that of Texas, which had the lowest percentage of all the states. See Digest of Education Statistics, National Center for Education Statistics,, Table 236.5, Common Core of Data, “National Public Education Financial Survey,” https://nces.ed.gov/programs/digest/d16/tables/dt16_236.50.asp?current=yes. ↑
- “Real Median Household Income in the United States,” website, FRED Economic Data, accessed March 10, 2017, https://fred.stlouisfed.org/series/MEHOINUSA672N, ↑
- See note 8. ↑
- “The State of Retirement: Grading America’s Public Pension Plans,” website, Urban Institute, accessed March 10, 2017, http://apps.urban.org/features/SLEPP/. ↑
- See note 8. ↑
- McCluskey, Neal, “How High is Teacher Pay in Oklahoma?” Oklahoma Journal of Public Affairs, 16 (2009), http://object.cato.org/sites/cato.org/files/articles/mccluskey-high-teacher-pay-oklahoma-june-2009.pdf. ↑
- McCluskey, Neal, “How High is Teacher Pay in Oklahoma?” Oklahoma Journal of Public Affairs, 16 (2009), http://object.cato.org/sites/cato.org/files/articles/mccluskey-high-teacher-pay-oklahoma-june-2009.pdf. ↑
- Richwine, Jason, and Andrew G. Biggs, Assessing the Compensation of Public-School Teachers, (Washington D.C.: The Heritage Foundation, November 1, 2011), http://www.heritage.org/research/reports/2011/10/assessing-the-compensation-of-public-school-teachers. ↑
- Butler, Baylee and Byron Schlomach, Oklahoma’s Teacher Supply: Shortage or Surplus? (Oklahoma City, OK:1889 Institute, October 2016), http://nebula.wsimg.com/c4f098f15d5a09fd66e96d2172ec0fc9?AccessKeyId=CB55D82B5028ABD8BF94&disposition=0&alloworigin=1. ↑
- See Digest of Education Statistics, National Center for Education Statistics, Table 505.5, https://nces.ed.gov/programs/digest/d15/tables/dt15_505.50.asp?current=yes. ↑