Public Education Spending In a Historical Context
, quality = 82")
Author
Byron Schlomach
Abstract
This paper shows that since 1920, inflation-adjusted per-student spending in public education nationally has increased by a factor of 16 times, the pupil/teacher ratio has halved, and inflation-adjusted teacher pay has increased by a factor of 5 times. Oklahoma exhibits a similar pattern.
Full Text HTML
Public Education Spending In a Historical Context
Byron Schlomach
“Is there a teacher shortage today? There is only one answer to this question. There is still an appalling lack of trained teachers throughout the country. There is grave danger to the teaching profession and to the cause of education in the statements loosely made in some quarters that there is a surplus of teachers… The false cry that there is no teacher shortage must not go unchallenged… The public will gladly pay the bills when it appreciates the gain from reasonable investment in good schools.”
The Journal of the National Education Association, October 1921, p. 142[1]
Not much seems to have changed over the last 100 years. The excerpt above reads like it could have been pulled from newspapers almost anywhere the country. But in reality, a lot has changed in the intervening 100 years. Just from 1960 to 2013, spending per student, adjusted for inflation, more than trebled. The increase in average teacher salary and drop in the pupil/teacher ratio explain only $4,200 of the increase, less than half of the total $9,350 increase in per-student spending. The following table, and the illustrations which are based on it, tell the story of Americans sacrificing mightily for the sake of K-12 public education.
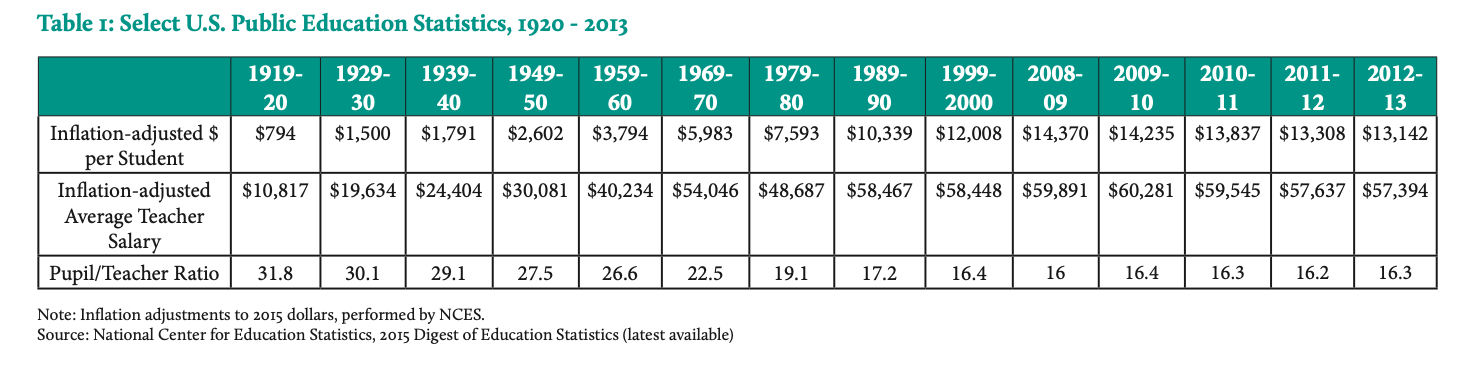
Figure 1 shows that from 1960 to 2009, inflation-adjusted spending per student quadrupled, increasing almost $2,000 per decade. From 1920 to 2013, spending per student rose by a factor of more than 16 times even as enrollment rates increased, meaning there was a huge infusion of resources into public education. Though only time will tell, an abrupt halt to this growth appears to have occurred with the Great Recession. The circumstances of the recession, challenging lawmakers and state budgets, apparently demonstrated that resources in public schools had been more than adequate for some time. Per-student spending has since been in decline.
Figure 1: Inflation-adjusted Spending Per Student, U.S.

Figure 2 shows that the student/teacher ratio had steadily fallen until about the year 2000 although the trend had slowed considerably by 1990. Given the continued geometric rise in spending per student from 1990 to 2009, it is apparent that little of the additional money was used to hire more teachers. The evidence is that non-instructional staffing levels have exploded in recent decades. Compared to 1920, the number of teachers relative to the number of students has approximately doubled. The national evidence is that the public school establishment was unlikely to increase relative teacher numbers significantly even if the Great Recession had not occurred, given that they previously had the resources to do so, but did not.
Figure 2: Student/Teacher Ratio, U.S.

Figure 3, when combined with Figure 1, shows that spending in public schools continued to rise even as the average teacher salary flattened, and for that matter, even as average salary fell in real terms during the stagnant and inflationary 1970s. Part of the spending growth was due to hiring relatively more teachers and continuing to bring down the pupil/teacher ratio. But even as the pupil/teacher ratio bottomed out, spending continued its $2,000 per decade rise. Likely due to the need to bid potential teachers away from other professions with rising incomes, the average inflation-adjusted teacher salary was slightly more than five times higher in 2013 than in 1920.
Figure 3: Average Inflation-adjusted Teacher Salary, U.S.

After seeing the statistics, it appears more than evident that Americans have stepped up and likely done more to lavish resources on public education than the writer of the quote from 1921 ever anticipated. The idea that public schools in the United States are being starved of what they need to fulfill their task, given the history of public education funding, is more than a stretch. Given the facts, it is more than reasonable to ask: 1) Where are all the resources going? and 2) Why can’t the schools do more with what they have? Based on the evidence here, it can definitely be said that new resources are not flowing to the classroom either in the form of more teachers or better teacher pay. The answer to the second question has many potential answers, but the evidence is that it should certainly be possible.
And what about Oklahoma? It shows the same basic pattern.
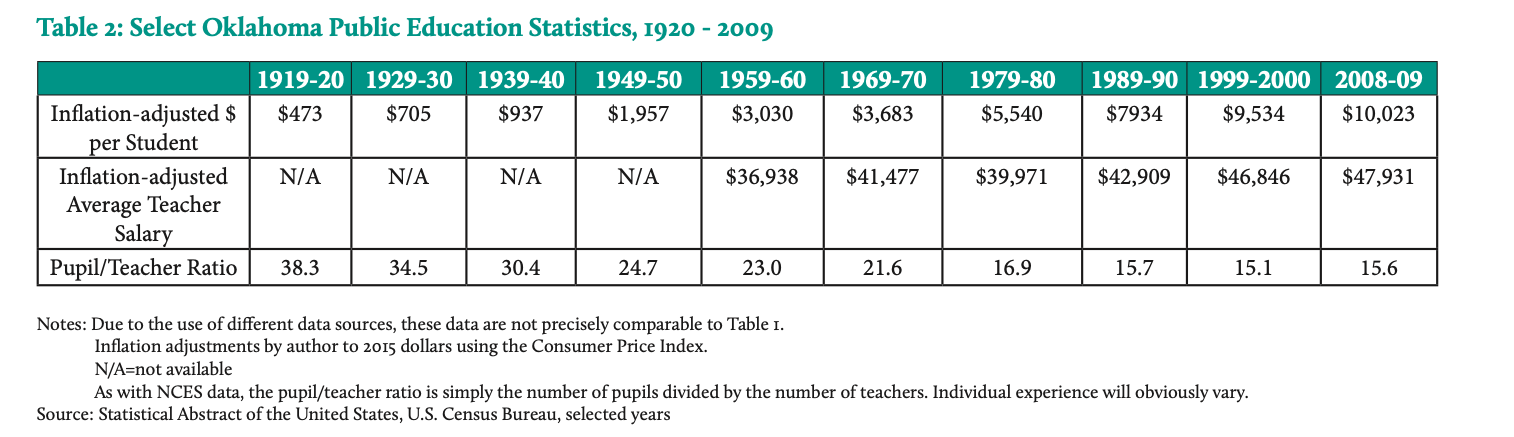
Figure 4: Inflation-adjusted Spending Per Student, OK

Figure 5: Student/Teacher Ratio, OK

Figure 6: Average Inflation-adjusted Teacher Salary, OK

________________________
- Originally excerpted by Mike Antonucci, “Analysis: The Hundred-Year Teacher Shortage,” The 74, website, December 20, 2016, https://www.the74million.org/article/analysis-the-hundred-year-teachers-shortage. Original in Google Books, https://books.google.com/books?id=t2IVAAAAIAAJ&printsec=titlepage&source=gbs_summary_r&hl=en#v=snippet&q=%22continued%20shortage%20of%20trained%20teachers%22&f=false. ↑