Oklahoma is a Medium, Not Low, Tax & Spending State

Author
Byron Schlomach
Abstract
This paper demonstrates that when state and local taxes and spending in Oklahoma are compared to the same in other states as a percentage of GDP, Oklahoma ranks surprisingly high in tax and spending metrics.
Full Text HTML
Oklahoma is a Medium, Not Low, Tax & Spending State
Byron Schlomach
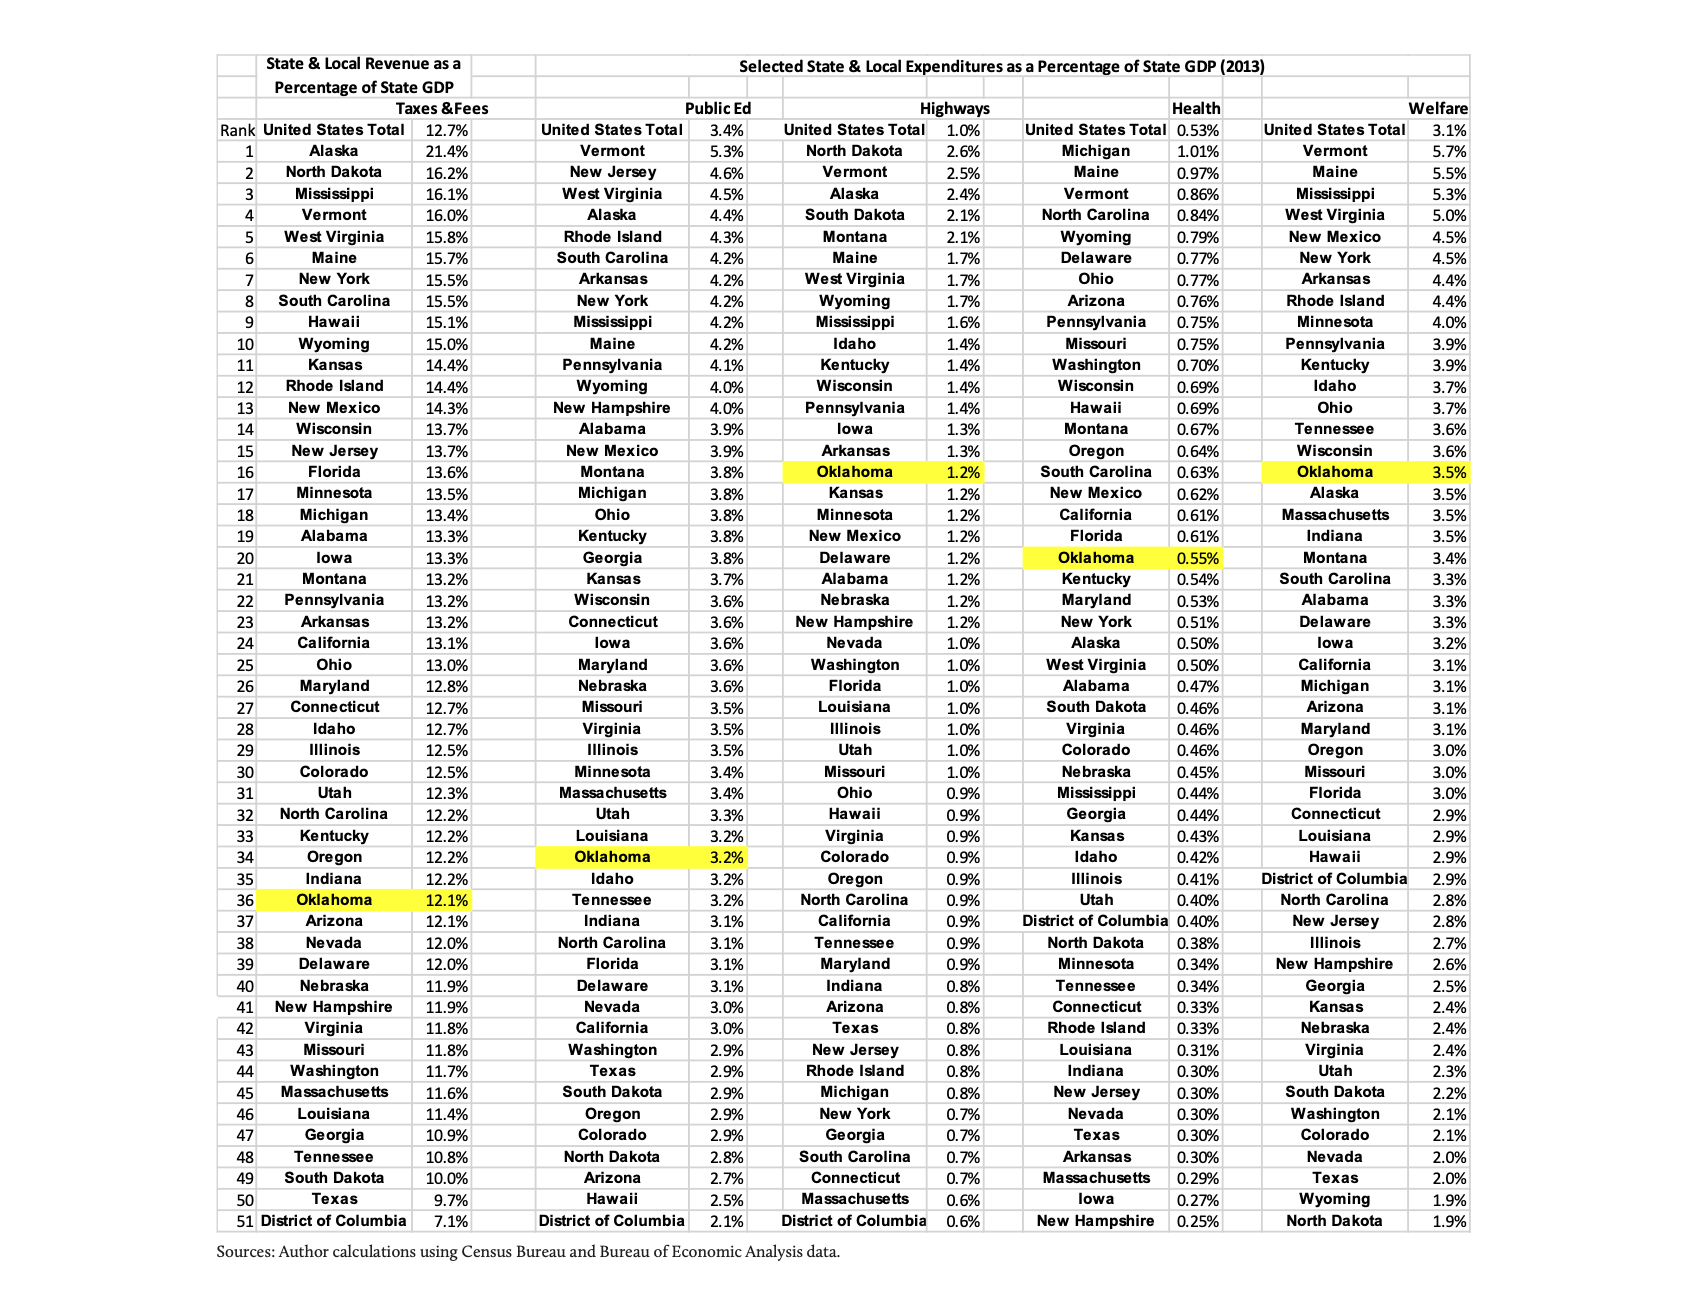
Out of the 50 states and DC, as a percentage of GDP, Oklahoma’s state and local governments are:
- 36th in how much they extract from the state’s GDP in taxes and fees. Oklahoma governments take more from its economy than Massachusetts (often called “Taxachusetts”) by this measure. Oklahoma is not a “low-revenue” state at all.
- 34th in spending on public education. Only a slightly lower percentage of GDP than in the U.S. as a whole and higher than Indiana, Delaware, California, and Washington.
- 16th in highway spending. Clearly, we have work to do.
- 20th in health spending. Oklahoma is not parsimonious in health spending, which includes Medicaid and other programs for the indigent.
- 15th in welfare spending. By this measure, Oklahoma is a high spending state.
How often do we hear, “Oklahoma is (some number between 40th and 50th) in spending among the states in (pick some area, usually health care or education)?” Or, another mantra is that Oklahoma is a “low-tax state.” In most instances, when one considers the affordability of government given the income of Oklahomans, these “facts” are not facts at all. They are conveniently constructed myths.
Consider the table printed on the back of this page. It shows state and local government revenues by states and the District of Columbia, as well as spending in several areas. The measures for tax and spending levels are expressed in percentages of the respective states’ gross domestic product (GDP). Note that Texas, our neighbor to the south, is consistently near the bottom in nearly every column.
Why look at taxes and spending on the basis of state GDP? The structure of state and local taxes varies dramatically from state to state. For example, some states don’t have income taxes and others are heavily reliant on income tax. Taxes and fees as a percentage of income is the best measure of the overall state and local tax rate.
As to spending, state GDP varies from state to state for a variety of reasons. One is that costs of living (prices) vary across states. Oklahoma’s per capita GDP can be as low as it is partly has to do with low prices in Oklahoma relative to most states. When total dollar spending on any given area in Oklahoma is compared to California, Oklahoma is likely to always look worse purely in dollar terms because prices here are lower. We can spend fewer dollars here and still get more for our money than in California.
Another reason for comparing state and local taxes and spending to state GDP is that the measures in the table reflect affordability for citizens and the sacrifices they make for government better than raw dollar measures. In total dollar terms, Oklahomans simply cannot afford as much government as people can in other states. Washington, D.C. is at the bottom of spending in public education despite remarkably high spending per student because GDP in D.C. is over $150,000 per person! We cannot afford the waste that they afford.
Data on tax and spending levels used to compute the percentages come from the Census Bureau. The Bureau of Economic Analysis produces state GDP data. The latest tax and spending data available are from 2013. GDP from the same year was used to compute the percentages. Revenue data are state and local revenues only, not including federal money. Spending levels do include federal funds.