Making Oklahoma’s School Funding More Rational: Simplifying the WADM Calculation

Authors
Byron Schlomach, Vance H. Fried
Abstract
This paper suggests simplifying the calculation of weighted student counts for school funding purposes by restructuring how different student age groups are counted, eliminating several weight categories, including those for gifted and economically disadvantaged students as well as those for small school and teacher longevity. Stricter enforcement of the bilingual and special education counts are suggested as well.
Full Text HTML
Making Oklahoma’s School Funding More Rational: Simplifying the WADM Calculation
Byron Schlomach and Vance H. Fried
Abstract
The complex school funding formula system in Oklahoma has its greatest complexity in determining Weighted Average Daily Membership, a method of counting students that is key in determining the amount of funding each school district receives. Very few individual students count only as one student. There are incremental additions in how much a student counts depending on what grade a student attends, whether the student is learning English, whether a student is disabled in some way, and whether a student lives in a small school district, among many other considerations.
This paper argues for the elimination of several student weighting categories, the study and revision of others, and a fairly specific revision of weights based on grade level. It then recalculates statewide funding parameters and, for some sample school districts, total formula funding and state aid for the 2016-17 school year, comparing these revised calculations to actual funding for each district. Total funding for that year is taken as a given and no change in total funding is contemplated.
Introduction
School funding in Oklahoma is complicated, not because the math is difficult, but because there are so many pieces involved. Even the 1889 Institute’s 30-page education funding primer, which delves deeply into the school finance formulas while attempting to make the system more understandable, leaves out some details.[1] The system is in need of simplification, if for no other reason than to make it more accessible to interested citizens.
The system also needs simplification because complexity opens a system to abuse. As argued below, too many Oklahoma students are classified as gifted, bilingual, and economically disadvantaged. There are a lot of student categories that result in additional funding for a district. Some carry more funding weight than others and not all are equally worth policing. Student counts have an impact on which districts get resources, thus the incentive to inflate counts that can be easily manipulated.
The first step in simplifying Oklahoma’s school finance system is to review and reform its weighted student count system. This is not with the intent to change the amount of funding the state feeds into the education system. Such reform would redistribute existing funding to some extent, although the intent is simplification. However, redistribution of funding may be justified given how the current system presents distorting incentives in reporting student counts for funding purposes.
For funding purposes, students are counted not just on the basis of their presence or registration, but also for their characteristics, such as whether they are considered gifted, are non-English speakers, or have some type of special education need. Student counts are the basis for funding but each child potentially counts as more than one child. For example, if a student is in first grade, she counts as more than one student (1.351 students, to be exact) for funding purposes, while a sixth grader counts as exactly one student. A senior counts as 1.2 students. Autism adds to a single child’s weight, or count, by 2.4 on top of whatever grade count the child would otherwise represent. This is a special education weight, of which there are eleven, ranging from 0.05 for the speech impaired to 3.8 for the deaf and blind.
There are other student weights. Students classified as gifted are counted another third while students who are bilingual or who are eligible for free/reduced-price lunches are counted as another fourth. All these weights add up. A first-grader (1.351) who is a non-English speaker, (0.25), poor (0.25), vision impaired (3.8), and autistic (2.4) would be counted as 8.051 (1.351 + 0.25 + 0.25 + 3.8 + 2.4) students for funding purposes. Such an extreme case is rare, but the central point is that the weighted student counting system is the first step toward complexity in the system and is therefore where the first step toward simplicity should occur.
Simplified Description of School Formula Funding
No discussion of how Oklahoma’s school funding formula system might be reformed can proceed without some explanation of how the system works. The description below is simplified somewhat, but is accurate and allows some focus on reforming the student-count system.
School districts in Oklahoma are mostly funded through a state formula system. The formula first determines the amount of funding to which a school district is entitled; then it determines how much of that funding must be provided by the state. The formula system determines how much funding will be provided from legislative appropriation in five basic steps.
First, students are counted on a weighted basis in every district and summed to determine a statewide weighted student count. Second, this count, all the dedicated state and local funds that accrue to the formula system, and state appropriations for that purpose are used to calculate so-called “funding factors” (“foundation” and “teacher incentive aid” factors – the names are anachronistic). Third, each district’s weighted student count and a count of how many students use transportation are calculated. Fourth, the weighted student count and funding factors are multiplied together to calculate the amount of formula funding to which each district is entitled. Fifth, local property tax revenues and various dedicated state revenues that are regionally based (the same that are used as statewide totals to determine funding factors) are subtracted. Any remainder must be made up by the state’s appropriation (which was used to calculate funding factors) and is called state aid.
The student count on which funding for a school district is based, because of the weights applied, is called Weighted Average Daily Membership, or WADM, and this is where most of the funding system’s complexity lies. Average Daily Membership (not weighted) is an actual count of students enrolled in a district on an average daily basis over a specific period of time. In addition to the weighted student counts mentioned above, WADM inflates student counts for small or relatively isolated districts and for districts with a large number of highly experienced teachers. Table 1 shows the final statewide weight counts for the 2016-17 school year.
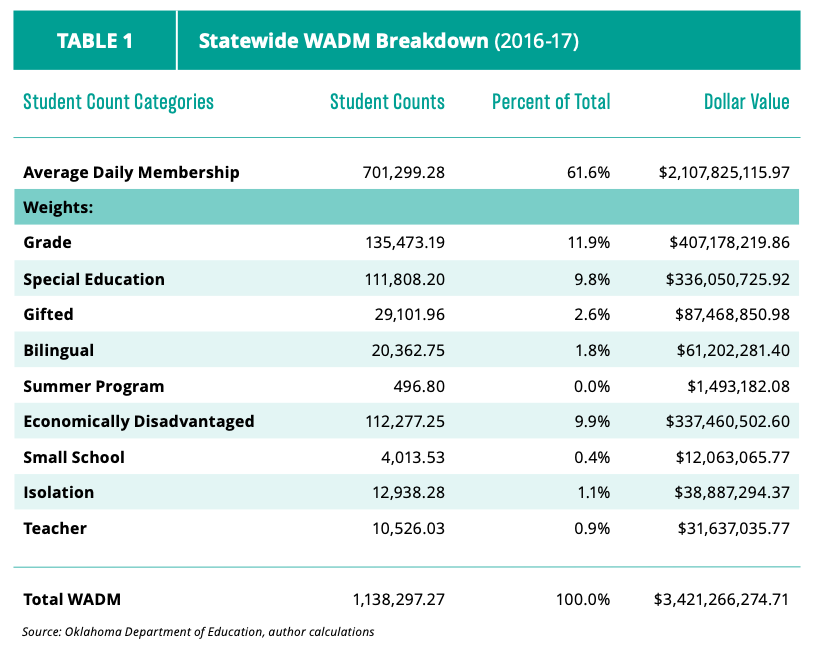
Note that the Summer Program weight, which few school districts claim, is very small, not even a rounding error. Also note that despite special education weights ranging up to 3.8, special education drives less than 10 percent of formula funding. Grade weights and the economically disadvantaged weight drive more funding than special education. Another small piece of formula funding, a transportation allotment, is not dependent on WADM. Nevertheless, WADM is the main driver of formula funding for school districts.
ADM and weight counts in Table 1 are overstated due to a 2-year hold harmless for districts that suffer a decline in WADM. Each year, WADM counts for the current and previous two years are compared and the highest WADM value is used to calculate funding for a school district. This is meant to protect school districts from the financial consequences of losing students for a time, allowing time to adjust.
Changing the WADM Calculation
With WADM the primary driver of formula funding for school districts, it makes sense that it should be the first place to look for reform and simplification opportunities. Three scenarios will be offered here, with funding implications illustrated using a handful of school districts as examples. But first, the individual weights need to be better explained in order to understand why each might be eliminated or changed.
Grade Weights
Depending on the grade a child attends, a child is counted differently and different funding levels accrue since the student count is multiplied by the funding factors to determine total formula funding. The second column of Table 2 shows current grade weights set in law. Although Table 1 presents grade weights as additive (counting a child and then adding a weight on top) like the other weights, in law they are not. One child in full-time kindergarten is counted 1.5, first and second graders are counted 1.351, and so on. Other weights are added on top of these values.
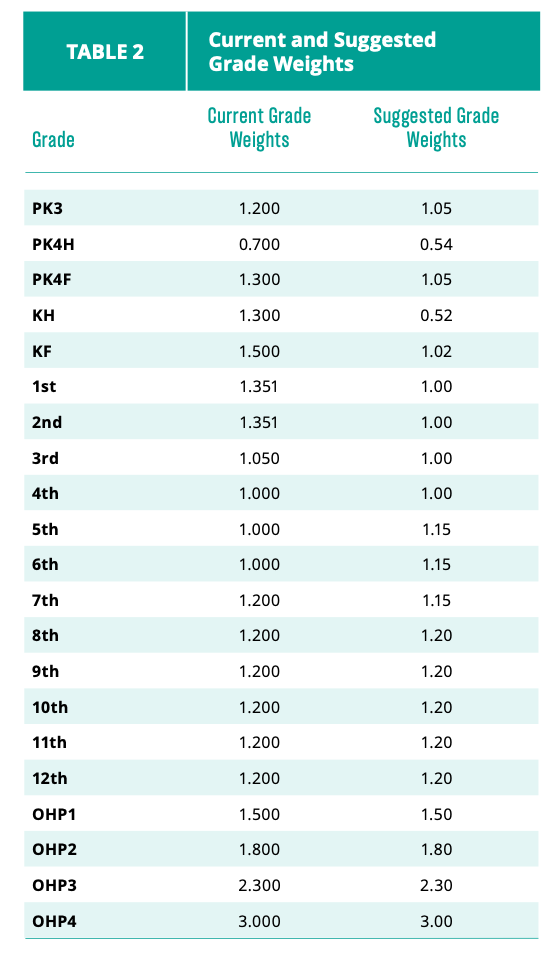
Grade weights range from 3-year-old prekindergarten to 12th grade, with half-day weights for 4-year-old prekindergarten and kindergarten. Half-time kindergarten carries a weight almost as high as full-time. Full-time kindergarten carries the highest grade weight of all while later elementary grades carry the lowest. Oklahoma is one of only nine states with compulsory attendance beginning at the age of 5. The rest start compulsory attendance at 6 and 7.[2] Oklahoma is one of only six states where 60 to 80 percent of 4-year-olds are served by state-funded pre-kindergarten.[3]
Regardless of one’s views regarding prekindergarten programs,[4] there is little doubt that Oklahoma over-weights the early grades. A perusal of tuitions charged by private schools that provide pre-K through high school programs universally shows early prekindergarten commanding only slightly higher tuitions than early elementary. Early elementary commands the lowest tuitions and tuition rises to its highest levels at the high school grades. Private school tuitions provide the best model for what relative tuition (spending) ought to be across school grade levels since private schools price without the intervention of politics and skillful advocacy.
The last column in Table 2 is a set of proposed grade weights based on private school practices and is arguably far more rational than the state’s current set of weights. First, the slightly higher weights in prekindergarten and kindergarten reflect the fact that many parents do not avail their children of this service, so economies of scale prevalent in other grades are not as likely. In addition, especially at age 3, assistants are often needed to help children with bathroom issues, although this is not the sort of work that requires a college degree. The proposed weights do not overfund half-day kindergarten. The earliest elementary grades, where only one teacher is required for around 20 children, have the lowest weights due to low equipment needs and since little specific subject-area knowledge is necessary from teachers. Higher weights in middle school and high school reflect fragmentation of the curriculum, resulting in smaller class sizes and the cost of providing a wide range activities, including sports, arts, music and other alternatives.
Special Education
No specific recommendations will be made here for changing special education weights. However, they should be reviewed, studied, and changes made accordingly. There might be a need for fewer or more than the current 11 categories. Some weights might need to increase while others, perhaps, could decrease. The development of various assistive technologies are likely to have made it easier and cheaper to work with certain disabilities, so a review of these weights is in order.
States that fund public education through student weights diverge a great deal in how much they weight and in the categories they weight when it comes to special education (and other areas, for that matter). Texas’ special education weight categories, for example, bear no real resemblance to those of Oklahoma while those of South Carolina and South Dakota do.[5] Table 3 shows Oklahoma’s special education categories and weights.
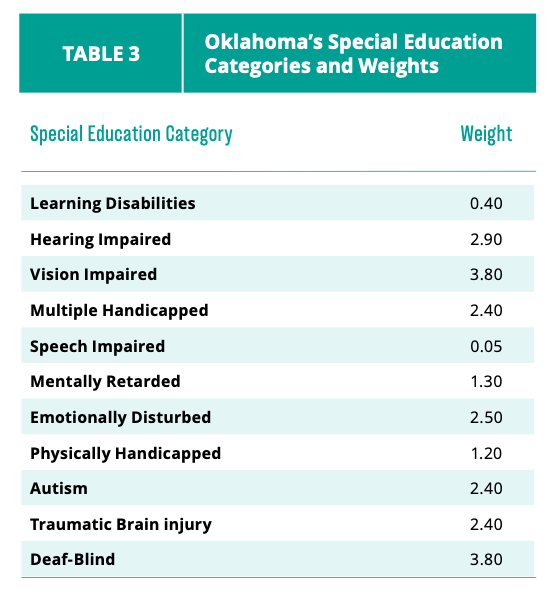
The “Learning Disabilities” weight is especially susceptible to abuse. While the weight is not huge, it is a sufficiently vague category that almost any student could qualify. Some might object that students and their parents are unlikely to want the stigmatization of being categorized as “special education.” However, any child so categorized has the right to an Individualized Education Plan, which involves meetings with parents, and accommodations such as extra time on tests and the right to turn work in late. These are privileges, not stigma.
Gifted
Eighteen states provide no specific funding for gifted education programs, including Massachusetts, New York, Connecticut, Vermont, New Jersey, Oregon, Arizona, and Montana.[6] Some of these states are viewed as having public education systems among the best in the country. Only four states of the fifty are considered to have “fully funded” gifted programs.[7] Two of these, Oklahoma and Georgia, fund gifted programming through formula funding.[8] In other words, Oklahoma is among a very small minority of states that explicitly and systematically funds education for students who are considered gifted. Each gifted student in Oklahoma receives a weight of 0.34.
A problem with providing explicit funding for gifted students is in identifying those who are truly gifted. The gifted funding weight, in itself, provides an incentive for school officials to identify students as gifted or to at least go along with parental pressure to do so. Statute provides for little discipline in identifying gifted students. While on the one hand it defines the gifted as any student scoring in the top three percent of a national standardized test, a high bar, it also includes students who excel in “creative thinking ability,” “leadership ability,” “visual and performing arts ability,” and “specific academic ability.” Combine this broad brush with additional vague criteria for identifying such students and the meaning of gifted becomes largely meaningless.[9]
Experts are not in agreement on what constitutes a gifted student. Depending on who is consulted, the percentage of students experts think might be gifted lies between 3 and 10 percent of the student population.[10] Over 12 percent of Oklahoma’s student count is classified as gifted. What’s more, since Oklahoma law explicitly requires that gifted funding only be spent on gifted programs,[11] the over-identification of students as gifted denies resources to general educational programming. If 10 percent of Oklahoma’s school children were identified as gifted, $15 million could be diverted to general programming. If 6.5 percent were identified as gifted, $40 million could be diverted. At 3 percent gifted, $65 million could be diverted.[12]
It is understandable that parents whose children show intellectual promise want them challenged. Truly gifted students may get bored, stories of them being bullied are common, and some do poorly in school for lack of peers. However, the numbers clearly indicate that most of those being identified as gifted are merely a bit smarter than average or are talented in a particular way. Minimally, the legislature should impose greater structure on the identification of gifted students. It could put a cap on the percentage of students so identified. The best policy, however, is stated in a Time article on the subject; parents and their students should be provided with more options.[13] That is, provide for more school choice and for greater flexibility within the school system, not just to those with special needs on the challenged end of the spectrum, but also for those with special needs on the high end of the spectrum.
The reality is that truly smart and gifted children are largely self-educating, not requiring more resources but fewer. The internet provides a direct pipeline to knowledge and these children need very little guidance in finding it beyond some direction to obtain a broad education. Given reality, a special weight for gifted children is nonsense as a policy response to their needs. The correct policy response is to allow parents to find the best educational situation for their children outside of traditional attendance boundaries while retaining the public funding to which they are entitled. Therefore, the alternative weighted funding scenarios considered below do not include a gifted student weight.
Bilingual
The bilingual weight (value of 0.25) is actually a weight for English Language Learner (ELL) students, children whose first language is not English. No doubt, it takes extra resources, for a time, to bring ELL students into English proficiency. There have to be personnel available who can translate and they might command a justified salary premium. It might be necessary for such students to receive some special tutoring in order to keep them from getting behind while they learn English. However, children should be expected to learn English well enough within a year that they are no longer counted for the bilingual weight. At present, there does not appear to be a time limit for how long a child can be classified as having limited English proficiency.
Currently, almost 12 percent of Oklahoma’s students are counted toward the bilingual weight. As of 2014, less than 4 percent of Oklahoma’s population was Hispanic and born outside the United States. This is the most prevalent population with English as a second language.[14] With under 17 percent of the student population being Hispanic, it is not reasonable to believe that two-thirds of them are English language learners. The facts plainly indicate that the bilingual weight is significantly oversubscribed.
The actual percentage of students who should legitimately be counted as English learners is probably somewhere between 4 and 12 percent. Nevertheless, for the purposes of the first and second scenarios explored in this paper, the bilingual counts for the state and specific districts used as examples will not be adjusted. However, in a third scenario the bilingual count is reduced to half of its former value in each of the sample districts. It is a matter of conjecture, however, where the over-counting actually occurs. Were stricter criteria imposed by the state, no doubt some districts would be more heavily impacted than others.
Summer Program
The summer program weight funds summer programs for special education students. It is an extremely small funding category and is highly limited in scope, affecting only a few hundred students. It is ignored for purposes of this exercise. Given its limited scope, it should be considered for termination.
Economically Disadvantaged
Sixty-four (64) percent of students are counted as economically disadvantaged under Oklahoma’s weight system. These are students who qualify for the free or reduced-price lunch program, which is any student from a household with income at 185 percent of the poverty level or lower. For a family of four, 185 percent of the federal poverty level is $45,510. Some might find this level of income to be generously high and not question that such a high proportion of Oklahoma’s school children are classified as economically disadvantaged. However, other statistics strongly suggest that the economically disadvantaged weight is heavily over counted.
Only 49 percent of Oklahoma’s children are in households whose income falls below 200 percent of the poverty level.[15] It is simply mathematically impossible for the income threshold to drop to 185 percent (which would include fewer households) and have the percentage of the state’s children in that lower income range increase compared to a higher income threshold. Something less than 49 percent of Oklahoma’s school children are legitimately eligible for the free and reduced-price lunch program.
Questions about the economically disadvantaged statistic should have been asked long ago just based on well-known circumstantial evidence. Consider the fact that Oklahoma’s poverty rate is 17.3 percent.[16] The percentage of the population at or below 185 percent of the poverty level is, of course, higher than 17 percent. However, for 64 percent of the state’s children to qualify as economically disadvantaged we have to believe that the population with incomes under 185 percent of poverty is better than 50 percent. Yet, the median household income in Oklahoma (half of households are above and half below) is $48,568, far above 200 percent of the poverty level.[17] An average household in Oklahoma is 2.57 persons. This suggests that the proportion of children living at or below 185 percent of the poverty level in Oklahoma is actually well below 50 percent, even without knowing the statistic in the immediately preceding paragraph.
It should be no surprise that children are over counted as economically disadvantaged. Parents merely have to fill out a form declaring their income without any instruction to refer to pay stubs or tax returns. Administrators check it to see if the number falls below the qualifying income threshold. If so, the child qualifies for free food. That is, the parents do not have to spend their own money to provide meals for the child during school hours. There is no verification of declared income levels.[18] The incentives in this system, where there is no verification, are obvious.
It is not at all clear why economically disadvantaged children should receive any additional weight in the school funding formula. There is no academic reason to do so other than to provide access to technology, which is now quite inexpensive and is increasingly provided to all students regardless of income level in most schools, regardless of demographics. The free and reduced-price lunch program is federally funded (another incentive to be lax in counting who qualifies). Separate state funding for this population is not necessary for federal food-purchasing purposes. In fact, by not including this weight in the funding formula, the incentive to over count participants is countered, to some extent. School officials would more likely check declared incomes for accuracy. And if the federal government does under-fund the food program, it is all the more important that it be limited only to those who truly qualify.
For all the reasons just given, it is recommended that the economically disadvantaged funding weight be eliminated altogether. Nonetheless, the second funding scenario discussed below reduces the total economically disadvantaged weights only to half of the actual level. The other scenarios contemplate the weight’s elimination. This allows for more comparison and contrast in addition to illustrating what a transition period might look like. Keep in mind that the total amount of money in the system will not change due to the change in the funding weight. What changes is how the money is distributed.
Small School
Another funding weight that should be eliminated is the small school weight. It gives a boost in WADM to districts with fewer than 529 students, regardless of why the districts are small. This weight is explained in some detail in the 1889 Institute’s publication, A Primer for Understanding Oklahoma’s School Funding System.[19] Between the fact that the small school weight drives less than one-half of one percent of Oklahoma’s formula funding and the fact that it rewards small school districts for being small even when they are small by choice, it is recommended that the weight be eliminated altogether.
Isolation
In law, this is called the “sparsity-isolation” weight. It is calculated through a complex formula that adjusts student counts for different grade ranges and then makes a further adjustment based on the total area of a district. It applies only to districts more than 134 square miles in area and with fewer than 2.4 students per square mile. Many, but not all, small school districts qualify for this weight, and it is recommended that it be retained since it is clearly intended to help offset costs that accrue from being relatively small, not by choice, but by geography. Small school districts do, after all, suffer simply from being small. They are not able to take advantage of economies from being large. Class sizes are often small by necessity rather than due to intentional policy. Administration can also weigh heavier on a per-student basis due to the small size. The isolation weight’s formula is worth reviewing for possible reformulation, but the basic idea of the weight is sound.
Teacher
Named in full, this is the Teacher Experience and Degree Index Weight. Teachers are assigned index values that increase with years of experience and degree levels according to a table established in law. A total is computed for each district and compared to the state average, and along with an adjustment for the number of students counted as economically disadvantaged, this weight is computed.
As can be seen in Table 1, the teacher index weight drives less than 1 percent of WADM and formula funding. This is hardly adequate to incentivize districts to retain teachers or, for that matter, to reimburse them for the higher salaries long-serving, highly-degreed teachers receive. The teacher index weight is more an additional complication and calculation in the funding system than anything else. Therefore, it is recommended that it be eliminated.
Weight Recommendation Summary
To summarize the above discussion, it is recommended that the state’s grade weights be reformed to something more like those in Table 2; the special education, bilingual, and isolation weights should be retained, perhaps with some changes in parameter values and greater scrutiny over eligibility; the gifted, summer program, economically disadvantaged, small school, and teacher index weights should be eliminated altogether.
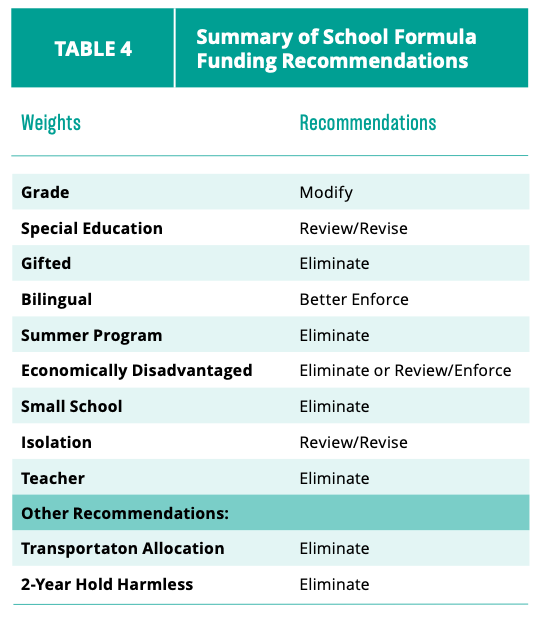
Two other reforms are recommended. First, as noted above, school districts experiencing declining WADM are held harmless for two years. Every school district’s current WADM is compared to its WADM from the two previous years and the district funded on the basis of the highest of the three years. This hold-harmless should be eliminated since there is little justification for it. Enterprises have to adjust to the loss of customers all the time. In some cases, school districts lose students because they are not very good. There is no sound policy reason to prop such districts up financially. The data to simulate the hold-harmless’ elimination are not readily available. However, to some extent the hold-harmless is eliminated in the simulations below because the grade ADM data are actual data for 2017. The rest of the weights, however, reflect hold-harmless values.
A second additional recommended reform is to eliminate the transportation portion of formula funding. In total, it amounts to $26.4 million, just 0.75 percent of total state and local formula funding. This is not enough to do more than provide a small subsidy to districts’ transportation systems. Besides, it is debatable whether schools should be in the transportation business, and if they must be, parents should arguably pay a transportation fee for the convenience. It is, after all, parents’ choice as to whether they avail themselves of the convenience of provided transportation, and parents make the choice of where to live. Besides, eliminating transportation formula funding is not the same as eliminating the funding altogether. Instead, it is recommended that the funds that would otherwise be allocated through the transportation formula be provided through the foundation and incentive aid formulas since the transportation allotment is so small.
Funding Scenarios
In order to get an idea of how funding allocations might change with the recommended changes in WADM, ten school districts were selected to see how their state funding might change. They include Oklahoma City, Tulsa, Muskogee, Piedmont, Anadarko, Okmulgee, Prague, Cordell, Gore, and Red Oak. It should be noted that the differences shown here will not precisely be the differences that would occur were the suggested reforms actually adopted. As noted above, changes in WADM here cannot fully take into account elimination of the two-year declining enrollment hold-harmless. Some of the more esoteric funding adjustments (which are ripe for elimination anyway) are not modeled, either. Regardless, the calculations below represent an honest and reasonably close effort to gauge what kinds of changes might occur with adjustments in the funding formula’s WADM calculations and they allow us to get a firmer idea of how the funding formula currently favors some districts over others.
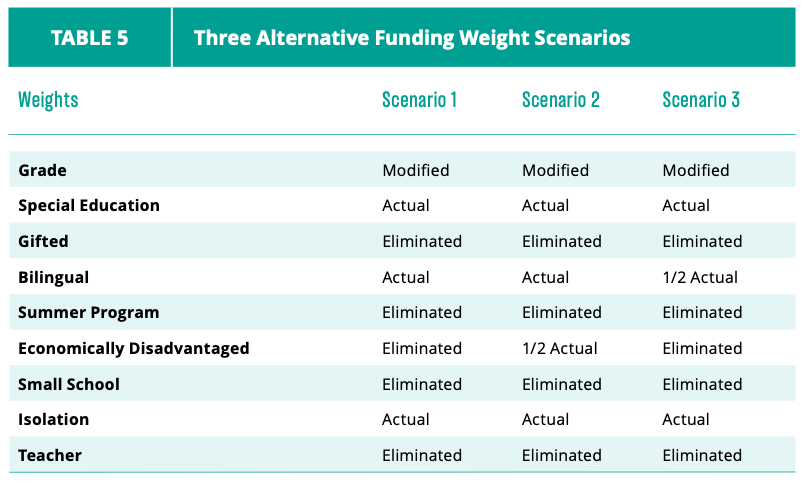
Three alternative weight count scenarios are illustrated and compared to actual formula funding for the 2016-17 school year below. As shown in Table 5, every scenario contemplates eliminating the gifted, summer program, small school, and teacher weights. The bilingual weight is left as-is in the first two scenarios and halved in the third one. The economically disadvantaged weight is eliminated in the first and third scenarios but only halved in the second.
Calculating the Scenarios
In calculating the three funding scenarios illustrated in Table 5, no change in total public education formula funding is contemplated. Instead, the changes in weights merely cause a redistribution of total funding among school districts. Some gain. Some lose. The only way to prevent a loss in funding for some school districts with a change in the funding weights is to add to total funding at the same time.
Recall that there are several steps involved in determining total formula funding for a school district and then the amount of that funding that is to be provided by the state (state aid). Oklahoma’s system works in a sort of feedback loop, which was described earlier. As a reminder, school districts submit their weighted student counts. These are totaled to obtain a weighted student count for the state as a whole. Separately, the legislature’s formula funding appropriation is combined with local and dedicated funds to determine a total, statewide amount of school formula funding. This dollar amount and the weighted student count are used to calculate two different “funding factors.” These factors and a district’s weighted student count are then used to determine the amount of total formula funding for a district. The amounts of local and dedicated funds the district receives are netted out to determine that district’s state aid.
To simplify, appropriations are combined with local and dedicated revenues to determine a total amount of school formula funding for the state. Combined with total student counts, formula parameters are derived. Then, formulas are used to determine how much of the state’s total formula funding and state aid each district receives. This contrasts to other states which first determine the formulas and then guess at the total appropriations required to honor them.
To calculate the scenarios contemplated here, total formula funding for the 2016-17 school year is taken as a given. Therefore, the first step is to determine a revised total weighted student count (WADM) for the state as a whole under each of the scenarios. This allows for the second step, which is to calculate the funding factor parameters needed to calculate each district’s share of formula funding and state aid. The third step is to calculate specific districts’ WADM under each scenario. This is needed for the fourth step, which is to calculate each district’s total formula funding. Actual local and dedicated revenues are finally used in the fifth step, which is to calculate each district’s state aid. All of these steps are conducted below with the results compared, and contrasted to actual funding.
Step 1: Determine Statewide Total Weighted Students
The first thing that must be calculated in order to simulate how changes in WADM impact districts’ state aid is total statewide WADM. Table 6 gives the same summary statistics as Table 1, but with the weights changed according to those specified in Table 5.
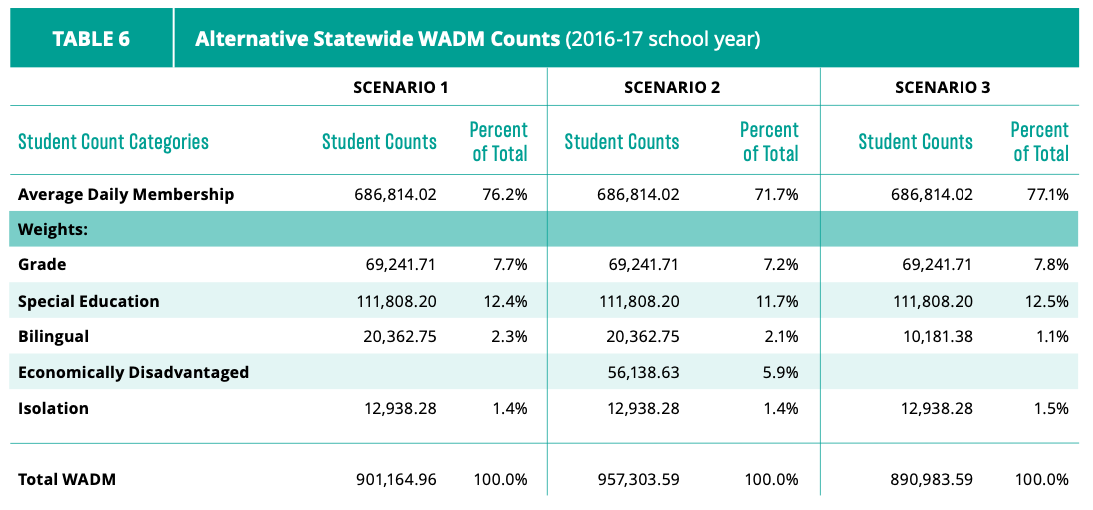
Note that the Average Daily Membership reported in Table 6 is lower by almost 14,000 than in Table 1. This number was calculated by referencing a statewide student count by grade, separate from the data source used in Table 1. Presumably the discrepancy is mostly due to the hold harmless being reflected in Table 1 rather than inconsistency among data sources at the Oklahoma Department of Education (ODE).
The grade weight in Table 6 is only a little more than half of that reported in Table 1 due to the change in grade weights as reflected in Table 2. In all three scenarios, the special education and isolation weights included in Table 6 are the same as those in Table 1. Only the bilingual and economically disadvantaged weights vary as noted in Table 5.
Step 2: Calculate Funding Factors
Funding factors are calculated using the amount of funding appropriated by the legislature for formula purposes and total local and dedicated funding sources, statewide. The methodology used to calculate the funding factors is explained in some detail in 1889’s publication, A Primer for Understanding Oklahoma’s School Funding System.[20] The greater the WADM, the lower the funding factors since the same amount of money has to be stretched over a larger count. Thus the state’s actual factor total in Table 7 is the lowest since actual state WADM is the highest of the three WADM measures illustrated. Remember, total statewide formula funding is being held constant. Scenario 3 has the highest factor total since that scenario’s WADM measure is the lowest number.
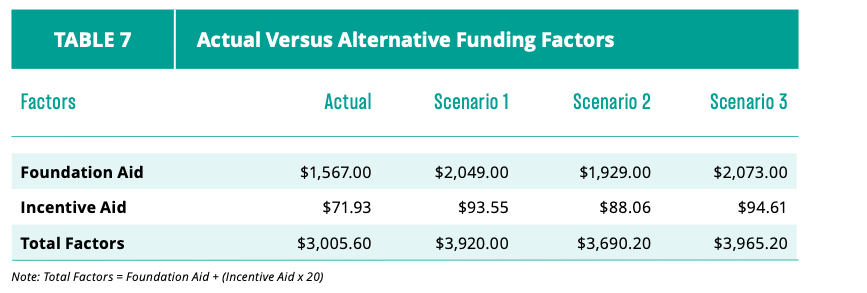
Note once again that the changes in funding factors are only a result of differences in relative WADM counts. The amount of total funding in the state does not vary.
As an aside, it is notable that the methodology used to calculate the funding factors is not specified in law. Perhaps at one time it was, but current practice results from long-established precedent, not statute.
Step 3: Compute District WADM
Table 8 shows what happens to each district’s WADM as a result of the changes to the WADM calculations suggested above. All of the district WADM counts in the three alternative scenarios fall a good deal compared to their actual WADM for 2016-17. After all, the grade weights are lower and several weight categories have been eliminated. However, it is interesting to note the differences among the scenarios for each district.
Keep in mind that the profound WADM changes shown in Table 8 will not translate into equally profound formula and state aid changes. This is because there are significantly higher funding factors that match each of the three alternative scenarios.
Piedmont is impacted relatively little from the variations in the bilingual and economically disadvantaged counts while the rest of the districts are impacted far more significantly. This is due to Piedmont’s much smaller bilingual and economically disadvantaged counts compared to the total student body in the actual count.
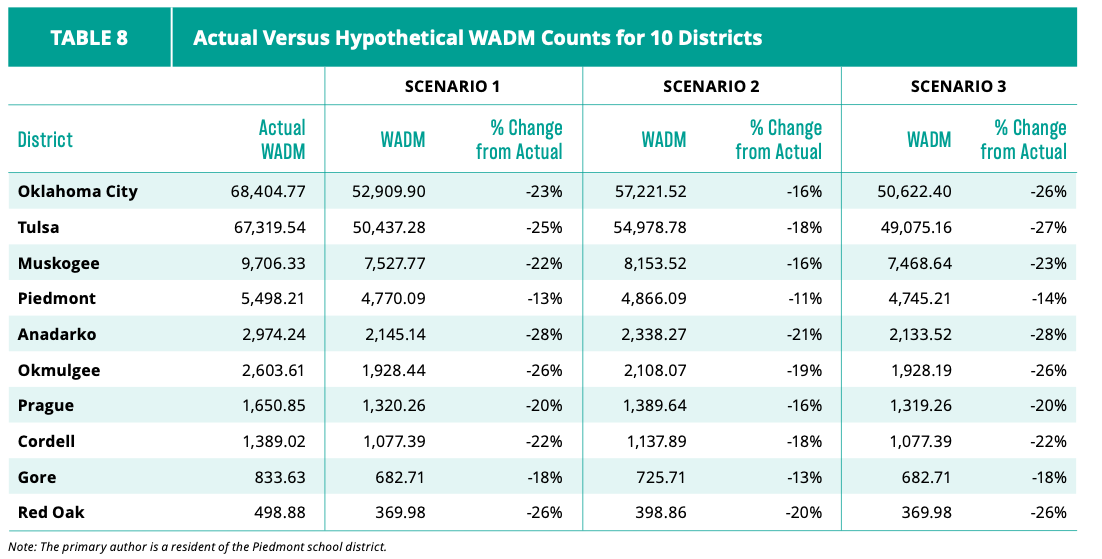
With no economically disadvantaged weight at all (Scenarios 1 and 3), Anadarko loses relatively more than the others with the losses mitigated somewhat when half the economically disadvantaged are counted in Scenario 2. That weight, under the state’s count, constitutes over 13 percent of Anadarko’s actual WADM (87 percent of its student body). Anadarko is also unusual in that the teacher weight constitutes 2 percent of its actual WADM. Anadarko’s bilingual weight is also twice as high as typical. The Red Oak district, which shows the second largest impact on WADM in the first and second scenarios, also loses significantly on the teacher weight. It also loses the small-school weight. In reality, Red Oak might regain some WADM from the isolation index. It is not possible to calculate that weight for purposes of this exercise, however.[21]
In relative terms, Oklahoma City and Tulsa lose the most in Scenario 3, where only half of the 2016-17 actual bilingual count is included. Depending on how accurate the bilingual count is for each district, the impact of cracking down in this student count category can vary considerably across districts.
Step 4: Calculate Total Formula Funding
The state determines actual total formula funding by multiplying each district’s WADM by the funding factor total and then adding a transportation allotment. The various totals for formula funding reported in Table 9 are computed using actual and each scenario’s WADM multiplied by the corresponding funding factor total. Recall that formula transportation funding has been rolled into the total and that allotment has been eliminated as part of the formula in each alternative scenario. The transportation allotment is included in the actual formula funding totals.
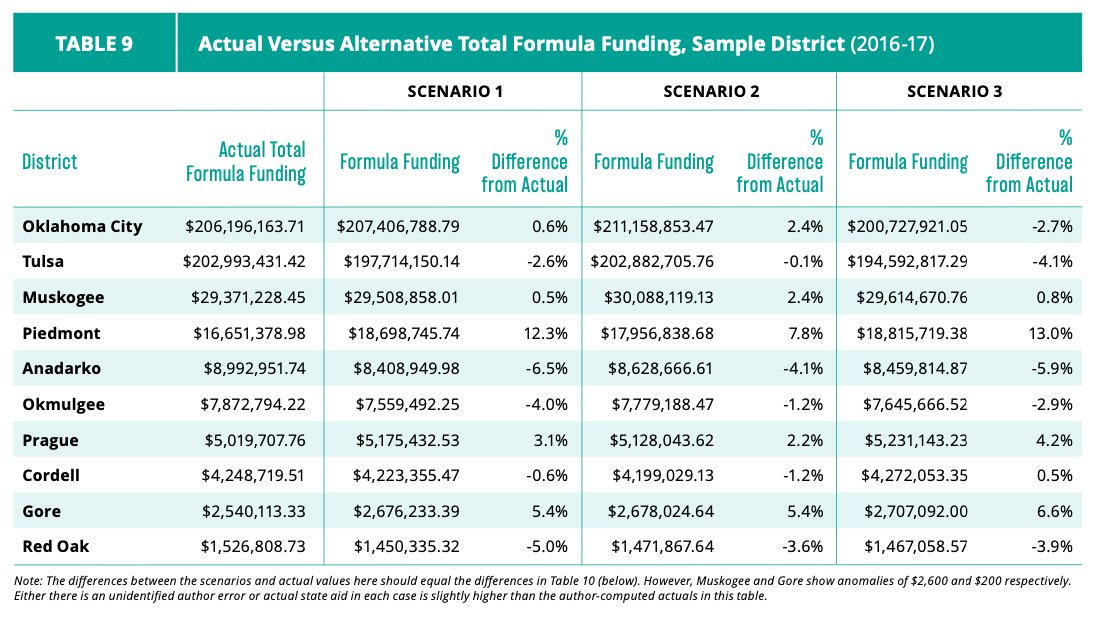
Note that especially Piedmont, and Gore as well, both see significant increases in total formula funding under the three alternative scenarios. This is because they have relatively small actual counts in the bilingual and economically disadvantaged categories. Thus, they benefit from the relatively high funding factors, having suffered relatively little in WADM loss due to the restructuring under each scenario.
Anadarko suffers the biggest relative loss in total formula funding in the alternative scenarios due to its relatively large alternative WADM losses. Nevertheless, the loss in funding is not nearly as profound as might have been thought because of the higher total funding factors in each alternative.
Tulsa suffers larger funding losses in every scenario than does Oklahoma City, which actually gains in Scenarios 1 and 2. Oklahoma City and Tulsa are very similar in size with Tulsa being slightly smaller. Nevertheless, Tulsa claims 50 percent more gifted and talented children, a weight eliminated in the alternative scenarios, than Oklahoma City. Tulsa also claims a significantly higher economically disadvantaged count than Oklahoma City. Oklahoma City suffers the most in Scenario 3 where its very high bilingual count (45 percent of all students) is impacted.
Finally, as noted earlier, Red Oak might not lose as much funding as it does in these scenarios because it might qualify for the isolation weight.
Step 5: Determine State Aid
Once the total amount of formula funding is calculated, certain deductions that account for actual and expected local and dedicated state tax collections in the district are subtracted. The remainder is state aid, the amount of funding that the state throws in to ensure that the district reaches the total formula funding. Table 10 shows actual and alternative scenario state aid amounts. In all four cases, the state aid shown in Table 10 is equal to the total formula amounts from Table 9 minus actual deductions from the 2016-17 school year.
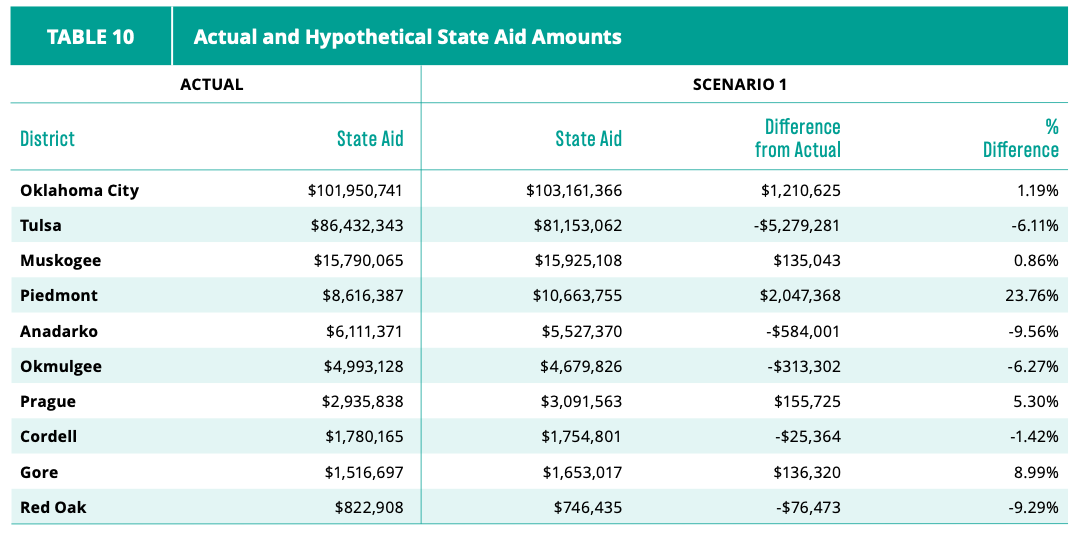
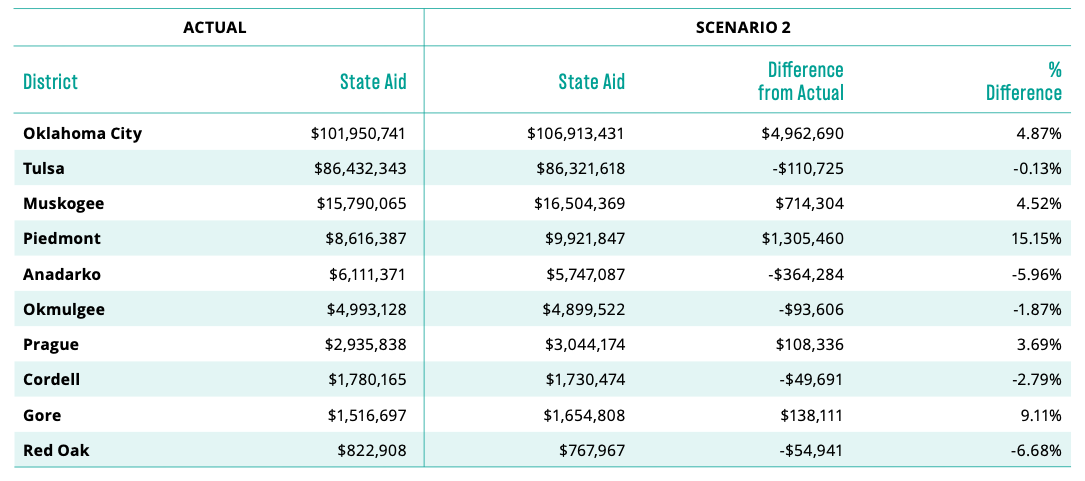
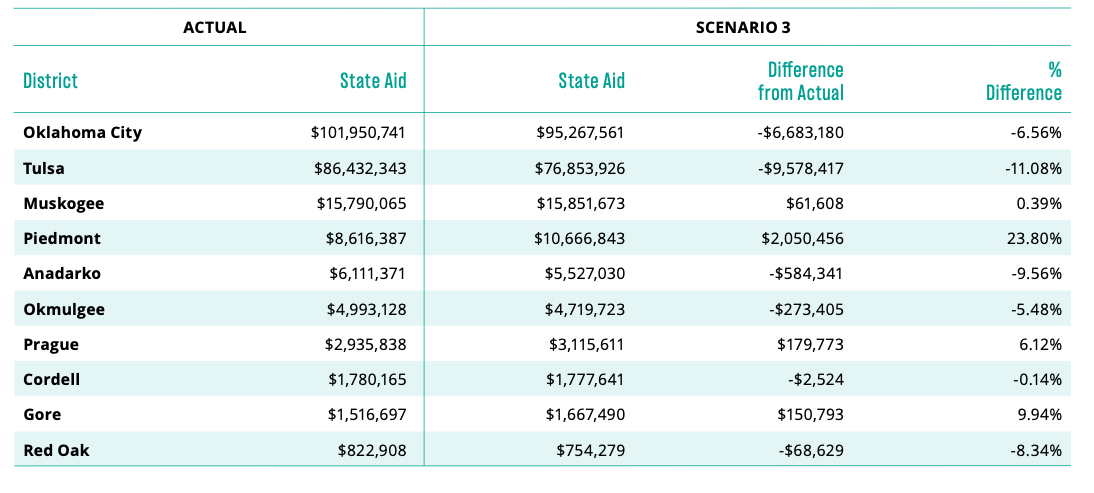
The bottom line with respect to the funding simulation is that any changes in WADM, will have redistributive effects on school districts. It should. Perhaps all school districts are over-counting some weighted student populations, but it appears some districts are over-counting more than others. Tulsa, for example, has 50 percent more students classified as gifted than does Oklahoma City, although Oklahoma City has slightly more total students. Oklahoma City’s bilingual weight, which implies that 45 percent of all students are English learners, seems excessive as well. Meanwhile, school districts that count accurately are being hurt financially by those who exaggerate weighted funding categories.
Conclusion
Any change in school funding, whether it makes the system more complex or simpler, will have a differential effect on school districts. The only way to avoid having some school districts lose funding with formula funding changes is to have the state increase overall funding. Regardless, simplification is worth the exercise and the pain. The current system is not rational. It leads to manipulation and gaming of the system. Because so many find it difficult to understand, it leads to a disengaged electorate, which only adds to potential abuse.
For these reasons, the state should adopt these recommendations:
1) Reform the grade weights to reflect pricing practices currently in private schools,
2) Retain but study and potentially change the special education, bilingual, and isolation student count weights,
3) eliminate the gifted, summer program, economically disadvantaged, small school, and teacher index weights,
4) eliminate the two-year hold-harmless for districts losing WADM, and
5) eliminate the transportation category in the state’s funding formula.
_______________________________
- Byron Schlomach, “A Primer for Understanding Oklahoma’s School Funding System,” Policy Handbook, 1889 Institute, July 2015, http://nebula.wsimg.com/93fea3897c30eeb77e8965c5f9ac13ec?AccessKeyId=CB55D82B5028ABD8BF94&disposition=0&alloworigin=1. ↑
- “Compulsory School Age: March 14,” 50-State Comparison, Education Commission of the States, http://ecs.force.com/mbdata/mbquestRT?rep=Kq1401. ↑
- W. Steven Barnett, et al, “The State of Preschool 2015: State Preschool Yearbook,” The National Institute for Early Education research, Rutgers Graduate School of Education, p. 11, http://nieer.org/wp-content/uploads/2016/05/Executive_Summary_2015_rev1.pdf. ↑
- The evidence to justify Oklahoma’s funding of early childhood education is weak, at best. See Katharine B. Stevens, “Does Pre-K Work? The Research on Ten Early Childhood Programs – and What It Tells Us,” American Enterprise Institute, April 12, 2016, http://www.aei.org/publication/does-pre-k-work-the-research-on-ten-early-childhood-programs-and-what-it-tells-us/. ↑
- “State Funding for Students with Disabilities: All States All Data: June 2015” 50-State Comparison, Education Commission of the States, http://ecs.force.com/mbdata/mbquest3D?rep=SD10. ↑
- “Support for Gifted Programs Vary Greatly from State to State,” Search Database, Davidson Institute, http://www.davidsongifted.org/Search-Database/entryType/3. ↑
- Ibid. ↑
- “State Funding for Students with Disabilities, All Data Points for States Using Formula Funding Mechanism, June 2015,” 50-State Comparison, Education Commission of the States, http://ecs.force.com/mbdata/mbfundallf?rep=SBFAF. ↑
- Oklahoma Statutes, Title 70 Sec 1210.301. ↑
- Andrew J. Rotherham, “The Illusion of the Gifted Child: Why Our Policies for Good Students Really Aren’t That Smart,” Time, April 25, 2013, http://ideas.time.com/2013/04/25/the-illusion-of-the-gifted-child/.Anya Kamenetz, “Who Are the ‘Gifted and Talented’ And What Do They Need?” NPR, September 28, 2015, http://www.npr.org/sections/ed/2015/09/28/443193523/who-are-the-gifted-and-talented-and-what-do-they-need. ↑
- There is a division in the Oklahoma Department of Education exclusively devoted to enforcing this provision in law. ↑
- These amounts are somewhat overstated because they do not account for adjustments that would occur in the state’s funding factors, which would rise and would fund the remaining gifted count more generously. ↑
- Rotherham, “The Illusion of the Gifted Child.” ↑
- “Demographic Profile of Hispanics in Oklahoma, 2014,” Pew Research Center, http://www.pewhispanic.org/states/state/ok/. ↑
- “Oklahoma Demographics of Poor Children,” National Center for Children in Poverty, Columbia University, http://www.nccp.org/profiles/OK_profile_7.html. ↑
- “US Poverty Level By State,” WorldAtlas, http://www.worldatlas.com/articles/us-poverty-rate-by-state.html. ↑
- “Oklahoma Household Income,” Department of Numbers, http://www.deptofnumbers.com/income/oklahoma/. ↑
- See the Economic Disadvantaged Application and Economic Disadvantage Application Instructions at “Economically Disadvantaged,” webpage, Oklahoma State Department of Education, http://sde.ok.gov/sde/economically-disadvantaged. ↑
- Schlomach, “A Primer for Understanding Oklahoma’s School Funding System,” p. 9. ↑
- Schlomach, “A Primer for Understanding Oklahoma’s School Funding System,” pp. 17-19. ↑
- Any further adjustments to WADM will impact the funding factor calculations. Several districts that no longer receive the small school weight under this simulation would qualify for the isolation weight. Thus, this simulation overstates the funding factors slightly compared to what they would actually be were the WADM recommendations followed. ↑