A Primer for Understanding Oklahoma’s School Funding System

Author
Byron Schlomach
Abstract
This paper describes Oklahoma’s common school formula funding in detail, providing many insights. In addition, an overview of the state’s public education funding is provided.
ERRATA: Three dollar figures on page 24 have been corrected from the previous version as of 1/04/17.
Full Text HTML
A Primer for Understanding Oklahoma’s School Funding System
By Byron Schlomach
This paper is intended for policymakers such as legislators, legislative staff, executive branch staff, school administrators, policy analysts, and highly motivated laymen who want to have a fuller understanding of Oklahoma’s formula funding for schools. Formula funding refers to yearly state-guaranteed minimum revenues to school districts, including certain local revenues, that are determined by a formula based on state-defined student and district characteristics. In 2014, about $3.3 billion of the total $5.9 billion spent by school districts flowed as a result of formula funding.
The most thorough resource previously available for learning about Oklahoma school finance is the State Department of Education’s Technical Assistance Document (the TAD or “tad)) which is published yearly with updated funding numbers. It has been heavily relied upon as a resource for this document. The TAD is a manual written by individuals already immersed in school finance. It is like a car repair manual which does not discuss the basics of how an engine works because this basic knowledge is assumed. The TAD serves its purpose very well, but it is not designed for someone new to school finance.[1]
This document is intended to fill the void left between highly simplified power point presentations and the TAD. The TAD provides more detail than this paper in some areas. This document provides some better understanding and explores some of the underlying mathematics of school finance that the TAD does not. Make no mistake. There will be unanswered questions for anyone who gains a thorough understanding of these pages. But, this will help those who need to ask the right questions a better idea of what those questions are. This document is intended to allow the reader to gain a quicker understanding of school formula funding in Oklahoma than if the TAD alone were relied upon. The TAD, though, is still extremely useful. This is not intended as a complete replacement of the TAD.
Oklahoma’s school finance system has a reputation for complexity. Some of this is deserved. Overall, however, the formulas for determining state funding for each district are straightforward. The complexity results from: 1) the many pieces of information required by the formulas, 2) the number of school districts, each requiring unique information, 3) the fact that a district might be funded using data from one or two years prior to the current year, 4) the role of local funding, 5) the plethora of sources of information and the timing of its availability relative to the school year, and 6) the backward engineering of key pieces of the school finance state funding formulas.
It is not possible to explain school finance at all fully without a learner feeling lost at some point due to the volume of details. To help alleviate this problem, tis paper begins with a summary of school finance facts and then provides an overview of the basic formulas. The formulas’ full meaning and the meaning of all the terms used must, of necessity, come later. The volume of information may seem daunting but it can be understood as the system is broken down and explained in the following pages.
Summary of Funding for Oklahoma Common Schools
Over the course of the 2013-2014 school year (henceforth shortened to 2014 for simplicity), common schools spent a total of $6.6 billion.[2] They received $5.9 billion in new revenue.[3] A breakdown of sources of common school revenue by level of government is shown in Table 1. In the past, state sources have funded a much higher percentage than in 2014. As will become obvious later, the state effectively appropriates a good deal of the local revenue as part of formula funding for school districts (about $1.1 billion in 2014). In other words, the state directly determined about $3.9 billion of common school revenues between appropriations, dedicated state revenues and mandated property taxes in 2014 (about 75 percent of the $5.1 billion state and local total).
It should be noted that the numbers just cited in the previous paragraph are not an all-inclusive accounting of total expenditures on public education in Oklahoma. As has been shown, other state agencies such as the lottery, horse racing, state land and tax commissions expend resources for the support of programs in the common schools. Portions of those agencies’ administrative costs can rightly be counted toward total common school education spending in the state. The actual total compared to that officially reported can be considerably different, especially if one includes changes in the unfunded liabilities of the teachers’ retirement system.[4] Such a comprehensive accounting has not been undertaken for the purposes of this paper.
Table 1: Sources of Common School Revenue (2014 School Year)[5]
| Amount | Percent of Total | |||||
| Local Revenue (District & County) | $2,378,256,290.05 | 40.6% | ||||
| State Revenue | $2,797,838,159.73 | 47.8% | ||||
| Federal Revenue | $681,618,237.22 | 11.6% | ||||
| All Funds TOTAL | $5,857,712,687.00 | |||||
Table 2 shows state revenue that counted toward formula funding amounted to 39.4 percent of total revenue for common schools. Part of this, 8.1 percent of the total, comes from state taxes that are dedicated to school funding but that are not part of the state’s appropriated aid. About 8.4 percent of the total in Table 1, or $492 million of total revenue to districts, was state funding that did not count toward formula funding in some way. Much of this is claimed, though, for such expenses as teacher health insurance and textbooks.[6]
Table 2: State Formula Funding for Common Schools (2014)[7]
| Amount | Percent of Total All Funds Revenue | |||||
| Net State Aid (appropriated) | $1,830,891,337.95 | 31.3% | ||||
| Dedicated Sources | $475,118,989.22 | 8.1% | ||||
On average, Oklahoma common schools directly spent $9,790 per student with only 43 percent of this going to instruction in 2014.[8] Taloga, a district with only 67 students in Dewey County spent the most per student at $26,609, with 42 percent of this on instruction.[9] The Copan district in Washington County, with 875 students, spent the least per student at $5,465 and 69 percent of this on instruction.[10] Three charter schools spent less per student than Copan and two of the three devoted a higher percentage to instruction than Copan. Of the 25 lowest-spending districts on a per-student basis, 14 were charter schools.[11]
Table 3 shows total spending per student, instruction spending per student, and instruction spending as a percentage of total spending for four size classes of school districts. While total average expenditures per student first falls and then rises as district size increases, instructional expenditures per student only fall as size increases. No size class spends even half of all spending directly on instruction. Particularly surprising is that the largest size class of districts (called “mega districts” here and listed in Appendix A) spends more per student than the smallest. For those who would consolidate districts to gain efficiencies, these data suggest that more might be accomplished by dealing with the large districts. In fact, judging by this analysis, it would appear that the economies of scale (falling average costs) many seem to think occur with larger district size and by extension, school consolidation, are exhausted at around 1,000 students in a district. Beyond that, diseconomies of scale (rising average costs) soon kick in and go into overdrive when a district has more than 10,000 students.
Table 3: Statewide Total and Instructional Spending Per Student by District Size, 2014[12]
| Size by Number of Students[13] | Average Total Expenditures per Student | Average Non-instructional Expenditures per Student | Average Instructional Expenditures per Student | Percentage of Total Spent on Instruction |
| 1 – 500[14] | $10,195 | $5,348 | $4,847 | 47.5% |
| 500 – 1,000 | $8,972 | $4,638 | $4,334 | 48.3% |
| 1,000 – 10,000 | $9,021 | $4,914 | $4,107 | 45.5% |
| 10,000 – 41,000 | $10,658 | $6,596 | $4,062 | 38.1% |
Just to gain some additional insight regarding school district size, Table 4 looks at total spending by districts in the four classes of school district size. As the table shows, while there was a large number of small school districts, they spent less than 13 percent of all common school spending in 2014. This is because only 12 percent of the state’s student population attended them. A mere 13 mega school districts had almost 40 percent of students and spent more per student in total and less per student on instruction than the smallest districts. The mega districts spent almost 40 percent of all funds spent in common schools. Though there were 305 school districts and charters with fewer than 500 students, more than half of all school districts, they had tiny student populations, so the real money does not lie with them. This suggests again that efforts to reform common schools to gain efficiencies should focus more on the mega districts than on the small ones.
Table 4: Statewide Total Spending by School Districts of Various Sizes, 2014[15]
| Size by Number of Students[16] | Total Expenditures[17] | Number of Districts & Charters | Percentage of Statewide Total Expenditures | ADM | Percentage of Statewide Total ADM |
| 1 – 500[18] | $846,563,981 | 305 | 12.8% | 81,553 | 12.1% |
| 500 – 1,000 | $655,707,145 | 103 | 9.9% | 73,082 | 10.8% |
| 1,000 – 10,000 | $2,486,949,444 | 120 | 37.7% | 275,696 | 40.8% |
| 10,000 – 41,000 | $2,611,772,288 | 13 | 39.6% | 245,045 | 36.3% |
Here is another way to interpret Tables 3 and 4. Looking at districts with 1,000 and more students, their populations amount to almost 80 percent of all students in the state. Their expenditures amount to almost 80 percent of total expenditures by common schools in the state. If we were to wring out 20 percent savings from districts with fewer than 1,000 kids through consolidation and other measures, that would mean statewide savings of only 4.5 percent. Meantime, if only 10 percent savings were wrung out of school districts with 1,000 and more students, statewide savings would amount to 8.8 percent.
Of the four classes of school districts in the tables, those with student counts in the 500 to 1,000 range spend the least per student in total and devote the highest percentage of that spending to direct instruction. Perhaps these districts’ size has a scale advantage.
Basic State Funding Formula Calculations
Conceptually, it is helpful to understand a basic principle of state formula funding for school districts before jumping into the math. The state finances a plurality of public education spending in Oklahoma, with much of this spending not determined by formula funding. The underlying purpose of formula funding is to guarantee that school districts have a minimum of funding given: 1) how much money districts can raise on their own, 2) the types and ages of students that happen to populate a given district, and 3) each district’s geographical circumstances. The formulas can be thought of as defining the size of a cup for each district (how much money to which the district is entitled). Each district fills the cup partially, some fuller than others, with its own property tax and other designated revenues. The state finishes filling the cup with state aid.
Now let’s dig in.
At its most basic level, school funding in Oklahoma consists of five calculations applied to each school district. First, student counts must be calculated. This is made complex by counting each student just a little differently depending on grade level and certain student characteristics. As will be explained below, counts are also influenced by district characteristics and teacher experience. This artificial student count, explained more thoroughly later, is called “weighted average daily membership” (WADM). [19] This number for each school district and the number of students eligible to ride buses (average daily haul or ADH) are used to make the other four calculations.[20]
The second basic calculation is of the state’s foundation aid. “Foundation Aid” is a term from statute. Under this calculation, the state makes sure every district has a minimum amount of money to spend considering the district’s weighted student count (WADM) and after taking account of several dedicated tax collections that accrue to districts.[21] The term, “foundation,” is likely an historical artifact from a day when school boards had some discretion over a district’s most basic, or foundational, property tax millage levy. Many states have two-part educational formula schemes with one of the parts considered “foundational.”
The third basic calculation is the “Transportation Supplement.” The amount computed accounts for how many students live at least 1.5 miles from their school (average daily haul) and their population density in a district. It is anachronistic in that the formula parameters are determined by the legislature and have not been adjusted in many years.[22] School districts’ spending on transportation bears little resemblance to their transportation supplement funding, as will be explored later.
“Salary Incentive Aid” for each district results from the fourth calculation which is based on the same student count (WADM) as foundation aid and a net calculation taking account of each district’s property wealth.[23] At one time, this category of aid was apparently intended to somehow encourage competitive salaries for teachers. Now, Salary Incentive Aid is just a term of law for one of the funding calculations. Under this part of the formula, the state makes sure school districts achieve a minimum funding level given their potential property tax collections as well as WADM count.
The final critical calculation, perhaps the most critical one, is the computation of the minimum level of funding guaranteed per weighted student (WADM) to districts under the foundation aid and salary incentive aid calculations. These are called “factors” ($1,574 for foundation aid and $72.90 for incentive aid in 2014). This computation is made prior to the individual district computations. However, discussion of this computation is explained last because it is easier to understand once familiarized with the other computations.
Below is a simplified example of state formula funding calculations for a school district from the 2013-14 school year whose weighted average daily membership (WADM) equals 1,005.64 and whose average daily haul (ADH) is 227.[24] Look at it carefully and note that once foundation aid, transportation aid, and salary incentive aid are separately computed, they are summed to determine total aid for the district from the state. Do not worry that there are terms that are not self-explanatory or that there is obviously detail left out, the terms and calculations are explained in more detail below, but it is important to get a picture of the forest before describing the individual trees.
Foundation Aid:
1,005.64 (WADM) X $1,574.00 (2014 foundation aid factor) = $1,582,877
Less certain local & state dedicated revenues (chargeables) = $1,315,268
Net Foundation Aid from state = $267,609
Transportation Aid:
227 (ADH) X $132 (value set in statute based on a density calculation)
X 1.39 (factor set in law) = $41,650
Salary Incentive Aid:
$72.90 (2014 incentive aid factor) X
20 (accounts for 20-mill property tax) X
1,005.64 (WADM) = $1,466,223
Less $37,638,803(adjusted district assessed property value) ÷ 1000 X
20 (millage) = $752,776
Net Incentive Aid from state = $713,447
Total Net State Aid:
$267,609 + $41,650 + $713,447 = $1,022,706
Notice that none of these basic calculations are particularly difficult. A few calculations of the underlying variables are complex, but none of the math goes beyond basic arithmetic operations.
This district received $1,022,706 from the state to make sure the district had a minimum of $3,080,750 ($1,582,877 + $41,650 + $1,466,223) to spend. In 2014, the state guaranteed that all districts would have $1,574 per WADM in foundation funds after accounting for other revenues the district received, including a 15-mill property tax, that count toward that part of formula funding. These dedicated revenues, explained and broken down below, are called “chargeables” since they are netted out, or charged to the district. In 2014, the 63 districts listed in Appendix B received no foundation aid money because the chargeables exceeded the guaranteed level of foundation funding.[25]
Every district receives transportation aid unless the district provides no transportation. There is no net calculation although financial penalties, explained later, can eliminate some of this funding. Charter schools, which are funded much like school districts, choose not to provide transportation and receive no such aid. One traditional school district, Bethany, does not receive transportation aid because it is geographically so small that no student is eligible for free transportation.[26] For the district in the example above, transportation aid amounted to $41,650 in 2014.
The sample district received $713,447 in incentive aid after accounting for expected collections from 20 mills in property tax. Assessed property value is adjusted each year to take account of previously protested valuations and is divided by 1,000 for the millage tax calculation. In 2014, school districts were guaranteed to have $72.90 per mill per WADM under the salary incentive aid calculation, for a total of $1,466,223 for this district. The district contributed $752,776. State aid made up the difference. In 2014, the 28 districts listed with asterisks in Appendix B received no net state incentive aid in 2014 due to their high assessed property values.[27] All districts have a claim on a minimum total 38 mills in property taxes for which formula funding is broken down and calculated for foundation aid and incentive aid.[28]
The sample district used here and referenced in other places in this paper is the Mooreland school district. Table 5 shows key formula funding variable for two additional school districts.
Table 5: Key 2014 Formula Funding Variables for Three Districts[29]
| Mooreland | Jenks | Tulsa | |
| WADM | 1,005.64 | 16,881.12 | 67,379.2 |
| ADH | 227 | 9,322 | 15,026 |
| Total Chargeables | $1,315,267.91 | $17,887,206.40 | $66,102,335.84 |
| Net Foundation Aid | $267,609 | $8,683,676 | $39,952,525 |
| Transportation Aid | $41,650 | $427,600 | $689,243 |
| 20-Mill Revenue | $752,776 | $13,909,254 | $44,323,895 |
| Incentive Aid | $713,447 | $10,703,419 | $53,914,978 |
Detailed Descriptions of Funding Components
The calculations shown above may be fairly simple, but there are many elements, the number of which make it seem far more complex than it really is. A lot of information from several different sources has to be brought together to calculate the amounts school districts receive in state funding each year. An exhaustive explanation of how and when every element comes together is beyond the scope of this paper. However, some of the information that is particularly relevant to school finance needs further explanation. For example, precisely what is weighted average daily membership (WADM)? How is it calculated? How does it potentially impact school finance? What are the chargeables? Where do the funding factors originate?
Weighted Average Daily Membership
Although the bulk of any school’s costs are associated with salaries and, therefore, staffing needs, schools around the nation are often funded on a student count and characteristic basis. To a great extent, this makes sense because staffing needs are generally determined by the number of students and their specific needs. Oklahoma is one such state that determines funding in this way and, in turn, determines the local/state split in funding responsibility from district to district. Thus, an important aspect of school funding in many states has to do with how individual students are counted.
Counting students may seem a straightforward task of counting heads. However, the number of heads often changes from day to day. Enrollment on day one of a school year is not likely to be the same every day for the rest of the school year. Attendance varies to an even greater extent. Different grade levels require different levels of instruction intensity. Very low grades require a great deal of personal attention. Higher grades require more course options and often more equipment in the classroom. Individual students vary in their abilities and educational needs, too, regardless of their grade level.
As a result of these complications, students are counted on a “weighted” and “average daily membership” basis. “Average Daily Membership” (ADM) is the sum over a given period of time of the number of students enrolled in a school district each instruction day divided by the number of instruction days. Enrollment is not the same as ADM. Enrollment is a number for a specific day. ADM is average enrollment over a series of days.
Grade Weight
ADM is broken down by grade levels and by types of students. Depending on the grade level and type of student, a single student can be effectively counted many times, a few times, or only one time, to come up with a weighted average daily membership (WADM) number for a district. On a grade-level basis under Oklahoma’s system, a fourth, fifth, or sixth grader is counted as a single student. Students at every other grade level are counted as slightly more than a single student. That is, students at all other grade levels are weighted, counting as more than one. These weights are determined in law and reproduced in Table 6. The legislature has not changed them significantly since before 1998.[30] Applying these weights for each student and summing them results in a value called Grade Weighted ADM or, in this paper, Grade WADM.
Table 6: Grade Weights for Determining Weight Average Daily Membership (WADM)[31]
| Grade | Weight |
| Early Childhood/Prekindergarten 3[32] | 1.2 |
| Early Childhood/Prekindergarten (1/2 Day) | 0.7 |
| Early Childhood/Prekindergarten (Full Day) | 1.3 |
| Kindergarten (1/2 Day) | 1.3 |
| Kindergarten (Full Day) | 1.5 |
| 1st – 2nd Grades | 1.351 |
| 3rd Grade | 1.051 |
| 4th – 6th Grades | 1.0 |
| 7th – 12th Grades | 1.2 |
| Out of Home Placement (OHP) 1[33] | 1.5 |
| OHP 2 | 1.8 |
| OHP 3 | 2.3 |
| OHP 4 | 3.0 |
Note that a single student in first grade counts as a little better than one-and-a-third units of WADM. A full-day kindergartner counts as 1.5 units of WADM. A half-day kindergartner, at 1.3 units of WADM, counts almost as much as a full-day kindergartner at 1.5. But, a half-day prekindergartner, at 0.7 units of WADM, counts just a little more than half of a full-day prekindergartner (1.3) for WADM purposes. The reason for the inconsistency in counting half-day kindgarten and prekindergarten is not clear.
Student Category Weight
Students are also separately weighted on the basis of various individual characteristics or categories as defined by the legislature and unchanged since at least 1998.[34] These characteristics impact ability to learn and, therefore, staffing needs. These weights are additive. That is, whatever grade weighting applies to a student, these weights are added on top. So, a child classified with “learning disabilities” receives an additional weighting of 0.4. “Vision impaired” is given a weight of 3.8. “Speech impaired” is weighted at 0.05. “Gifted” receives a weight of 0.34. “Bilingual” and “economically disadvantaged” (anyone eligible for the federal free/reduced-price lunch program) each are weighted at 0.25. Student category weights are determined by statute as shown in Table 7. Using these values, a WADM can be calculated for each of the categories, such as Gifted WADM and Economically Disadvantaged WADM.
Table 7: Student Category Weights[35]
|
Student Characteristic |
Weight |
Student Characteristic |
Weight |
| Learning Disabilities | 0.40 | Autism | 2.40 |
| Hearing Impaired | 2.90 | Traumatic Brain Injury | 2.40 |
| Vision Impaired | 3.80 | Deaf-Blind | 3.80 |
| Multiple Handicapped | 2.40 | Special Ed Summer Program | 1.20 |
| Speech Impaired | 0.05 | Gifted | 0.34 |
| Mentally Retarded | 1.30 | Bilingual | 0.25 |
| Emotionally Disturbed | 2.50 | Economically Disadvantaged | 0.25 |
| Physically Handicapped | 1.20 |
These weights can accumulate for a single student. So, a low-income child in eighth grade whose first language is not English, has emotional problems, and has a physical disability, could be counted as 5.4 students for WADM purposes as follows: (eighth grade) 1.2 + (economically disadvantaged) .25 + (bilingual) .25 + (emotionally disturbed) 2.5 + (physically handicapped) 1.2 = 5.4.
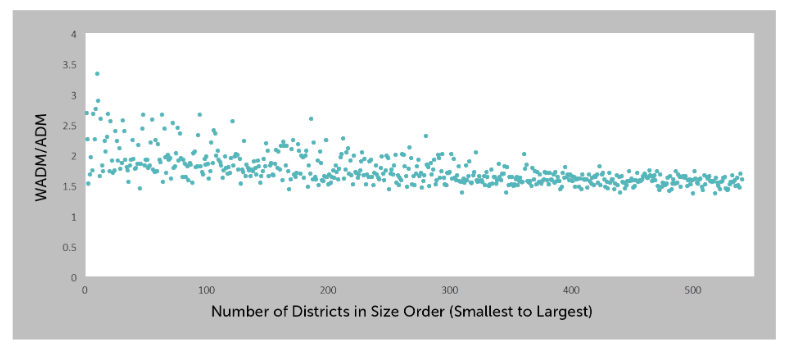
Given that student category weights can so inflate the student count, one might think that it is common to have weighted ADM counts exceed actual (often called “raw”) ADM counts by a factor of three or four. Actually, fewer than one-fifth (81) of all school districts and charters receiving formula funding had a WADM to ADM ratio greater than two; only one district exceeded three in 2014. And, these ratios include weights not yet discussed. On the other hand, only 54 had a WADM/ADM ratio of 1.5 or less, which means that for the vast majority of districts, the average student was weighted between 1.5 and 2, which is a significant range, given how the state aid formulas work. In the state as a whole, the WADM/ADM ratio equaled about 1.6.[36] Table 8 and Figure 1 show how district WADM/ADM ratios tend to fall with district size. One reason for this is because smaller districts receive additional weighting through one of two other weights discussed next.
Table 8: School District WADM/ADM Ratio Comparison by Size Classification[37]
| Size by Number of Students[38] | Average WADM/ADM Ratio |
| 1 – 500[39] | 1.82 |
| 500 – 1,000 | 1.62 |
| 1,000 – 10,000 | 1.57 |
| 10,000 – 41,000 | 1.58 |
Figure 1: WADM/ADM Ratio Comparison, All Districts[40]
Small School District Weight
Weighting is also assigned on the basis of school district size or sparsity of student population. The size and sparsity weights are two different weights and they are mutually exclusive. If a district gets one, it does not get the other, though a district is entitled to the larger of the two. The weight based on size is called the “Small School District Weight” in law and it is common for the weight to be more simply called the small school weight in conversation.[41] The sparsity weight is called the “Sparsity-Isolation Weight” in law and is often referred to as the isolation weight.[42]
The small school weight only applies to school districts with an ADM count less than 529. Better than half of all school districts have an ADM count low enough for the small school weight to potentially apply.[43] Many of these, however, receive the sparsity weight, instead. The small school weight is mathematically calculated with this formula:
Small School Weight = [(529 –ADM)/529] X .2 X ADM
Rearranged algebraically, it can be seen that this is a formula for an inverted parabola:
Small School Weight = (105.8 X ADM – .2 X ADM2)/529
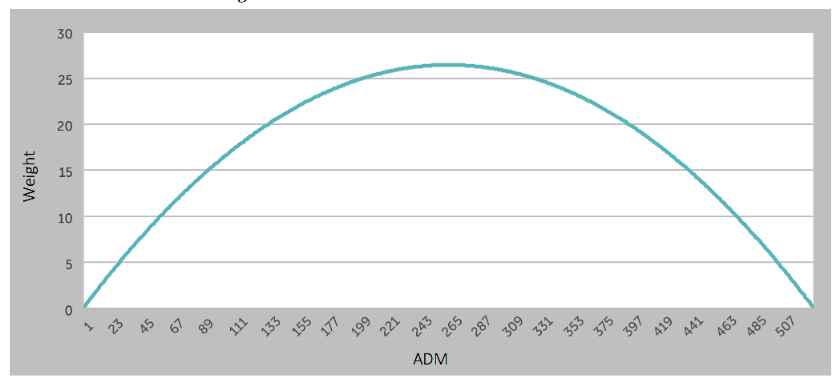
The small school weight formula is engineered so that the weight is the same for an ADM of 1 as for an ADM of 528. It’s the same for an ADM of 2 and for an ADM of 527, and so on, creating the pattern shown in Figure 2. The maximum value of the small district weight is 26.45 at an ADM of 264.5. In 2014, this was worth about $80,200.[44]
Figure 2: The Small School District Weight, by District ADM[45]
Sparsity-Isolation Weight
The sparsity weight can apply to any district that has an area greater than 134 square miles and an ADM per square mile (called areal density) less than 2.4 (i.e., fewer than 2.4 students per square mile). At least nine districts with more than 529 students (ADM) received the sparsity weight in 2014.[46] Districts with fewer than 529 students are eligible to receive the sparsity weight, and many do. However, a district that is eligible for both weights only receives the larger of the two. The sparsity weight can be much higher than the maximum for the small school weight. In fact, the Felt school district in Cimarron County had an ADM of 88.1 and a sparsity weight of 100.43 in 2014. The sparsity weight alone made up 43 percent of that district’s WADM.[47]
The sparsity weight is far more complex to calculate than the small school weight. Total ADM for a district is split into ADMs for three grade ranges: pre-kindergarten through fifth grade (EC-5), sixth through eighth grades (6-8), and ninth through twelfth grades (9-12). Then, three separate calculations are made as follows:
EC-5 Cost Factor = [74/(ADMEC-5 +23) + .85] X ADMEC-5 = CF5
6-8 Cost Factor = [122/(ADM6-8 +133) + .85] X ADM6-8 = CF8
9-12 Cost Factor = [292/(ADM9-12 +128) + .85] X ADM9-12 = CF12.
These results are summed and the sum’s proportional increase over ADM is multiplied by how many percent larger than 134 square miles is the district (not to exceed 100 percent). Then, this result is multiplied by total ADM. The result is the sparsity weight. Mathematically, this is:
Sparsity Weight = (((CF5+CF8+CF12)/ADM)-1) X ((Area-134)/134) X ADM
Obviously, the higher the sum of the cost factors the higher the sparsity weight. Also, the greater a district’s area above 134 square miles (with nothing above 268 square miles counting), the higher the sparsity weight. ADM has a push-pull effect on the calculation.
Notice that each of the cost factor calculations (CF5, CF8, and CF12) essentially just calculates an adjusted ADM for each grade range. If the adjusted ADM sum is equal or less than actual total ADM, the sparsity weight will equal zero since the ratio of the adjusted sum to actual ADM will be less than one.
The sparsity weight is engineered to favor low-student-count and geographically large, sparsely populated districts. It is designed to yield less weighting for districts as their student counts rise, holding area constant. Because of the different parameter values in each of the three cost factor equations, a different actual ADM for each grade range determines whether that grade range contributes to a sparsity weight. For grades EC-5, that actual ADM is anything less than 477. For grades 6-8, that actual ADM is anything less than 680.33. For grades 9-12, that actual ADM is anything less than 1,818.67.[48] Values higher than these subtract from a district’s potential sparsity weight. Why these values? That is a mystery.
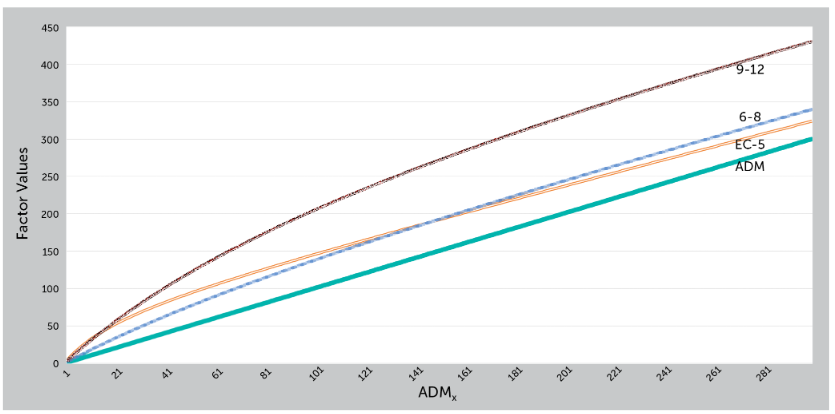
Given the number of variables, the sparsity weight’s series of calculations does not lend itself to a pictorial display. However the behavior of the individual cost factors for each grade range as their respective ADMs vary are illustrated in Figure 3. As can be seen, even accounting for the fact that the grades 9-12 factor includes four grades and the 6-8 factor only includes three, high school is much more heavily weighted than the other grades in the sparsity formula.
Figure 3: Sparsity Weight Cost Factors[49]
Teacher Experience and Degree Index Weight
One final component of WADM remains. This is the weighted teacher experience/degree index calculation. This calculation financially rewards districts whose teachers are, on average, more experienced and/or highly educated than teachers in the state as a whole. Every teacher in the state is assigned a weight as shown in Table 9. Note that, except for the last experience increment, a teacher’s weight increases by 0.1 with each additional three years of experience and by 0.2 with each additional degree above the bachelor’s level.
Table 9: Teacher Experience & Education Weight Values[50]
|
Years of Experience |
Bachelor’s Degree |
Master’s Degree |
Doctorate |
| 0-2 | .7 | .9 | 1.1 |
| 3-5 | .8 | 1.0 | 1.2 |
| 6-8 | .9 | 1.1 | 1.3 |
| 9-11 | 1.0 | 1.2 | 1.4 |
| 12-15 | 1.1 | 1.3 | 1.5 |
| Over 15 | 1.2 | 1.4 | 1.6 |
A Weighted Average State Teacher number is calculated for the entire state by summing all the weights for each teacher and dividing by the number of teachers. In 2014, this value was 1.0806.[51] The same average is calculated for each district using its teachers’ weights to determine a weighted average district teacher index value. If the district’s average is equal to or lower than the state’s, then the district receives no additional WADM on this basis. Many districts fall into this category. Otherwise, a district receives WADM using this formula:
Weighted Teacher WADM = (Weighted Average District Teacher – Weighted Average State Teacher) X
.7 X (Grade Weighted ADM + Economically Disadvantaged ADM)[52]
The teacher weight appears to be intended as an incentive to retain and pay highly experienced and educated teachers, giving an advantage to districts with high numbers of economically disadvantaged students. A hypothetical example of how the teacher weight is computed is provided in Appendix C in order to aid the reader’s understanding.
Total WADM
Now, all the elements that make up WADM have been discussed. Total WADM for a district is calculated by adding the grade WADM, the WADMs for each of the pupil categories, the applicable size or sparsity WADM, and the weighted teacher WADM. No two school districts have the same weights assigned because each and every district is uniquely financed for its particular student and teacher circumstances. More than anything else, the WADM calculation is meant to capture these unique differences and insure that school districts are minimally funded to account for them all.
The state produces a detailed weight information sheet for each school district every year. The detail weight information for the three districts illustrated earlier can be found in Table 10.
Table 10: Selected Districts’ 2014 Detail Weight Information[53]
| Weight Category |
Mooreland WADM |
Jenks WADM | Tulsa WADM |
| ADM* | 535.26 | 11,137.47 | 40,025.76 |
| Grade† | 106.83 | 2,156.42 | 8,267.69 |
| Special Education | 79.00 | 1,614.95 | 5,918.35 |
| Gifted | 23.46 | 628.32 | 1,646.62 |
| Bilingual | 3.50 | 328.50 | 2,592.75 |
| Summer Program | 0.00 | 0.00 | 31.2 |
| Economically Disadvantaged | 70.25 | 1,017.25 | 8,898.75 |
| Small School | 0.00 | 0.00 | 0.00 |
| Isolation (Sparsity) | 187.34 | 0.00 | 0.00 |
| Teacher Index | 0.00 | 0.00 | 0.00 |
| Totals | 1,005.64 | 16,882.91 | 67,381.12 |
Notes: * ADM is the actual (or raw) Average Daily Membership.
† The grade weight is net of ADM – i.e., only those parts of the grade weights greater than 1.0.
Notice that many of the student category weights are rolled into the single special education weight classification, which is not all that high. The special education weights in all three districts is about 14.7 percent of ADM. This indicates that few students are categorized as visually or hearing impaired, autistic, or a number of other categories that carry high weights. This is typical. Jenks and Mooreland do not offer special education summer programs, so this weight is zero. None qualify for the small school weight since their ADM is greater than 529 but Mooreland does qualify for the sparsity weight, which lends significantly to its total WADM. Teachers are insufficiently experienced and educated in any of these districts for it to qualify for the teacher weight.
General Remarks About WADM
- Looking back at the various grade and student category weights in Tables 6 and 7, it is not obvious that any of the values are the correct values in any sense. The weights were determined at least two decades ago. Exactly how they were determined, the strength of the data behind them, and whether they are relevant for today are all matters for further research. In fact, the variation of similar weights among states is good evidence that student funding weights are quite arbitrary.[54]
- Table 11 contains the same detailed weight information for the state as a whole as Table 10 does for the sample districts. A few things are worth noticing. For one thing, the largest of the three most complex WADM calculations contributes less to total statewide WADM than any other category except for the summer special education program weight. The isolation weight contributes just a little more than 1.1 percent of the state’s total WADM. The small school and isolation weights together contribute only 1.5 percent of the state’s total WADM. So, the notion that consolidating small school districts into larger ones will significantly help to improve the state’s education funding situation through financial savings seems to be highly questionable, at least on the basis of the state’s weighted counting system.
Table 11: Statewide 2014 Detail Weight Information[55]
| Weight Category | WADM | Percent of Total |
| ADM | 683,355.37 | 63.8% |
| Grade | 130,883.81 | 12.0% |
| Special Education | 94,280.70 | 8.7% |
| Gifted | 28,254.68 | 2.6% |
| Bilingual | 18,255.25 | 1.7% |
| Summer Program | 385.20 | 0.03% |
| Economically Disadvantaged | 107,677.00 | 9.9% |
| Small School | 4,157.53 | 0.4% |
| Isolation (Sparsity) | 12,406.73 | 1.1% |
| Teacher Index | 9,103.64 | 0.8% |
| Total WADM | 1,088,759.91 | 100% |
- The teacher index weight is also very small, contributing less than 1 percent to total WADM. Perhaps this weight was intended to encourage school districts to retain highly experienced teachers. But, given the fact that a school district’s teacher experience index has to be higher than the statewide average’s in order to receive any weighting, this is a very weak incentive. When a district’s index rises, holding everything else constant, so does the state’s. This is almost like a dog chasing its own tail. Combine this with the fact that there is no penalty for falling below the state’s average, and it is easy to see that it is mostly happenstance, and rarely by any conscious effort to keep teacher experience, that a district receives this weight.
- Surprisingly, the special education weight, which combines a number of the higher-value student category weights, amounted to less than 10 percent of the state’s total WADM. Converting the gifted WADM into raw ADM, the total indicates that over 12 percent of the student population was classified as gifted in 2014. The percentage of student population classified as economically disadvantaged was 63 percent. This number appears to deserve further scrutiny given that a relatively small 17 percent of Oklahoma’s population is in families than earn less than the official poverty level of income. To be counted as economically disadvantaged, a child must qualify for the federal free and reduced-price lunch program. A student is eligible when the family income is 185 percent of the poverty level or less.
- It is odd that the sparsity weight more highly weights high school than other grade ranges. Presumably, the main reasons for a sparsity weight would be to offset the diseconomies of having a small district made necessary by a very low-density population. That means the costs of administration would be spread over relatively few students. The small school weight accounts for this, but it is clear that the formulas are designed not to overly reward districts just for being small. Instead, the sparsity weight is for districts that are small by necessity. Another reason for weighting on sparsity is for transportation, partly accounted for with transportation aid. Why administration or transportation would be more costly for high school is not obvious.
Calculating Foundation Aid
Recall the following foundation aid calculation from the example above:
Foundation Aid:
1,005.64 (WADM) X $1,574.00 (2014 foundation aid factor) = $1,582,877
Less local dedicated revenues (chargeables) = $1,315,268
Net Foundation Aid from state = $267,609
With WADM already calculated for a school district, this calculation becomes fairly straightforward. Two issues remain, though. One is where the $1,574 foundation aid factor comes from. The other is the subtraction of chargeables: What are they?
The computation of the factors for the foundation aid and incentive aid calculations will be explained later. For now, it should be understood that the foundation aid factor of $1,574 is a guaranteed level of funding per unit of WADM for every district only for foundation aid. State aid makes up the difference after certain other sources of revenue that count toward foundation funding, the chargeables, are taken into account. These will now be discussed in more detail. Table 17 shows a breakdown of the three sample districts’ actual chargeables from their detailed funding calculation worksheets produced by the state. Mooreland is listed first since its calculations are illustrated.
Table 12: Sample Districts’ Foundation Aid Chargeables[56]
| Chargeable | Mooreland | Jenks | Tulsa |
| Ad Valorem | $648,159.66 | $11,408,599.15 | $35,571,360.34 |
| County 4-Mill Levy | $106,580.25 | $1,565,870.25 | $5,923,243.50 |
| School Land Earnings | $72,110.00 | $1,508,670.00 | $5,703,555.00 |
| Gross Production | $76,561.00 | $71,429.00 | $66,321.00 |
| Motor Vehicle | $185,108.00 | $3,378,229.00 | $18,828,016.00 |
| R.E.A Tax | $226,749.00 | $8,403.00 | $9,840.00 |
| Total Chargeables | $1,315,267.91 | $17,887,206.40 | $66,102,335.84 |
The Ad Valorem chargeable refers to the amount of potential current-year revenue from a 15-mill property tax that all districts assess called the Certification of Need levy.[57] Almost all districts actually charge a rate slightly more than 15 mills. They are allowed to do this because the original 15-mill tax, defined by the constitution, was applied to residential personal property (essentially, contents of homes). All but a few districts have stopped assessing residential personal property and are allowed to charge some extra millage to make up the difference.[58]
The County 4-Mill Levy refers to an anachronistic tax from Jim Crow days for funding “separate” schools.[59] This tax’s revenue is apportioned among districts in a county on an Average Daily Attendance basis. However, only 75 percent (3 mills) of prior-year revenue from this tax is counted toward the foundation aid calculation’s chargeables.[60]
School Land Earnings references prior year proceeds from the state’s federal trust lands. Federal trust land is land granted to Oklahoma by the federal government upon statehood. Revenues that accrue from land still owned by the state and revenues from investment earnings that result from investing the proceeds of land sales are distributed to school districts.[61] These earnings, from the state’s land office, are distributed to districts on an Average Daily Attendance basis.[62]
Gross Production refers to prior year proceeds from the state’s gross production tax, a tax on the extraction of gas, oil, and other minerals in the state. This is often called a severance tax in other states. A portion of the proceeds from each county are returned to the counties for distribution to independent (K-12) school districts on an Average Daily Attendance, basis.[63] The fact that K-6 and K-8 districts do not receive this distribution makes little difference since the loss is made up by state aid. The same is true for districts in counties that produce little oil.
Motor Vehicle refers to prior year proceeds from a portion of the state’s motor vehicle tax. Like the gross production tax, this only accrues to independent school districts. The state defines the distribution, which is not dependent on respective district or county collections, though it flows from the state through county treasuries.[64]
R.E.A. Tax references a Rural Electrification Association cooperative tax, a property tax on rural electric cooperatives that is distributed to districts proportionally on the basis of the number of miles of transmission lines in each district served.[65]
In the state as a whole, the guaranteed foundation total (before chargeables under the foundation aid calculation) in 2014 amounted to $1,713,736,614.82. Net foundation aid after chargeables were subtracted amounted to $775,276,408.00.[66] Table 13 shows total statewide chargeables for 2014. Surprisingly, the gross production tax contributed the second lowest amount. After property taxes, motor vehicle taxes contributed more than twice as much revenue to districts than any one of the other sources.
Table 13: Total 2014 Statewide Chargeables for Calculating Foundation Aid[67]
| Chargeable | Amount |
| Ad Valorem | $453,029,099.70 |
| County 4 Mill Levy | $84,489,984.00 |
| School Land Earnings | $93,000,002.00 |
| Gross Production | $60,196,841.00 |
| Motor Vehicle | $238,717,326.00 |
| R.E.A Tax | $35,001,277.00 |
| Total Chargeables | $964,434,529.70 |
Although several of the distributions to school districts that count against their state foundation aid are distributed on an attendance basis rather than a membership basis, this makes no real difference in the total amount of money most school districts have to spend. Only school districts that are fully or nearly fully funded by the chargeables and receive little or no foundation aid would be affected by changing the basis on which these various revenue sources are distributed to districts.
Calculating Transportation Aid
Transportation aid consists of three variables as shown in the sample district calculation from above.
Transportation Aid:
227 (ADH) X $132 (value set in statute based on a density calculation)
X 1.39 (factor set in law) = $41,650
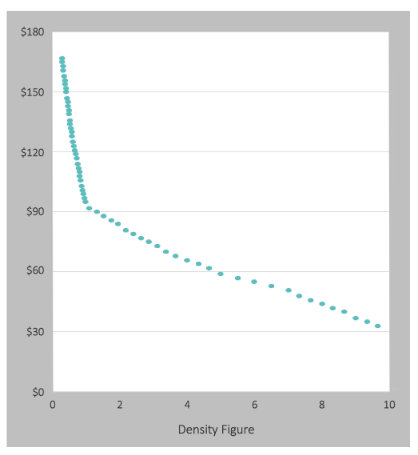
Average Daily Haul (ADH) is the number of students in a district that live more than 1.5 miles from their assigned school. It is not actual ridership. A per capita allowance is obtained from a table, which is in statute. The table defines an amount based on a district’s ADH density, defined as the district’s ADH per square mile of district area. The per capita amount varies from $33 per ADH for the densest districts to $167 per ADH for the least dense districts. The last parameter is called the transportation factor, which is equal to 1.39. The transportation factor and the per capita amounts are specified in law and have not changed in many years.[68]
Although the actual table of ADH density and associated per capita amounts is not reproduced here, the values from the table are plotted in Figure 4.[69] At an ADH density of about 1.1 (1.1 eligible students per square mile), the per capita allowance rises more rapidly as density falls. The reason for this is not obvious.
Figure 4: Graphical Representation of the Per Capita Transportation Allowance[70]
As shown for the Mooreland school district, the three parameters are multiplied together to determine total transportation aid. The result is entirely state funded. No local funds are subtracted. Statewide, in 2014 transportation aid amounted to only 12 percent of total transportation spending, and transportation aid is a similarly small fraction of any school district’s spending on transportation. [71] Actual transportation spending in 2014 for Mooreland was about $352,000 and transportation aid was $41,650, about 12 percent of actual transportation spending. Table 14 shows these values for the three sample districts.
Table 14: State Transportation Aid versus Actual Transportation Spending (2014)[72]
| Mooreland | Jenks | Tulsa | |
| Transportation Aid | $41,650.00 | $427,600.00 | $689,243.00 |
| Actual Transportation Expenditures | $351,588.34 | $4,218,681.65 | $13,218,102.17 |
| Aid as Percentage of Actual | 11.8% | 10.1% | 5.2% |
In the state as a whole, $25,920,795 was in transportation aid was distributed to districts. Statewide ADH was 401,886 in 2014.[73]
Calculating Salary Incentive Aid
Conceptually, salary incentive aid ensures that every district has a minimum level of revenue for every mill of property tax per unit of WADM. The minimum revenue per mill per WADM floats. That is, it is subject to change every year, as does the foundation aid per WADM ($1,574 in 2014). In 2014, the minimum revenue per mill per WADM was $72.90. In the next section, how these floating factors are determined will be explained.
To calculate salary incentive aid for a district, the first calculation must be to determine the total guaranteed amount of revenue. This is accomplished by multiplying the minimum revenue per mill per WADM by the number of mills that are guaranteed, which is 20 mills, and then by WADM for the district. This calculation for the sample district is repeated here:
$72.90 (2014 incentive aid factor) X
20 (accounts for 20-mill property tax) X
1,005.64 (WADM) = $1,466,223.
Every district is guaranteed a minimum amount per WADM for 20 mills of property tax because every district taxes at that level. So, the only part of this calculation that varies from district to district is WADM.[74]
Three constitutionally allowed property taxes make up the 20 mills of property tax that counts toward the incentive funding. The Local Support levy makes up 10 mills. The Emergency levy (now anachronistically named) makes up 5 mills. Finally, 5 mills of the 15-mill County levy must go to schools and makes up the difference to obtain the 20 mills.[75]
The second part of the salary incentive aid calculation is to compute the amount of property tax that the local district contributes. So, district property value, adjusted for prior year tax protests, is divided by 1000 to account for the fact that the property tax is expressed in mills. Then, the result is multiplied by 20, the millage level. This gives the amount of property tax of the district that counts toward the guaranteed salary incentive total, as shown in the example.
Less $37,638,803(adjusted district assessed property value) ÷ 1000 (millage conversion) X
20 (millage) = $752,776
In the Mooreland district’s case, the district can only raise a little more than half of the amount that the state guarantees will be available under the salary incentive aid. In fact, instead of $72.90 per mill per WADM, the district only raises $37.43 per mill per WADM ($752,776÷20÷1,005.64). The state makes up the difference, which comes to $713,447, the district’s net incentive aid as shown in Table 5 above. Jenks raises $41.20 per mill per WADM with the state providing $10.7 million in incentive aid. The state provides Tulsa with raises $53.9 million in incentive since the district raises only $40.01 per mill per WADM.[76]
In the state as a whole, districts were guaranteed $1,587,160,473 in incentive funding. District property taxes covered $560,505,629 of this amount. That is, on the whole, district property taxes raised $25.74 per mill per WADM of the guaranteed $72.90 per mill per WADM. The state made up the difference with $1,034,479,371 in funding.[77]
The state produces a detailed state aid calculation sheet for every school district and charter school. In comparing the simplified aid calculation in this paper to the state’s calculation sheet for Mooreland, the biggest difference is in the salary incentive aid calculation. The calculation presented in this paper and the one on the state’s aid calculation sheet are exactly mathematically equivalent. However, the calculation in this paper makes it a little easier to understand the funding factor discussion in the next section and the minimum guaranteed revenue logic behind the calculation.
Here is the salary incentive aid calculation from the sample district’s detailed state aid calculation sheet[78]:
SALARY INCENTIVE AID:
1: INC. AID GUARANTEE FACTOR (72.90) X
INC. WEIGHTED ADM (1,005.64) = $73,311.1560
2: ADJUSTED DISTRICT VALUATION
($37,638,803) / 1000 = $37,638.8030
3: #1 – #2 = $35,672.3530
4: #3 X INCENTIVE MILLS (20.0) = $713,447.00
The calculation in this paper multiplies 1: and 2: by 20 (representing millage) upfront, yielding the $713,447 result in one fewer steps using the distributive property of multiplication.
The Foundation and Incentive Aid Funding Factors
As has been noted earlier, two key amounts, the $1,574 foundation guarantee per WADM and the $72.90 incentive guarantee per mill per WADM, change from year to year, and even within a year, as explained below. These two amounts are collectively called funding factors and are separately referred to as the foundation aid factor and the incentive aid factor, respectively. Their final values for the 2015 school year were $1,609 and $73.29, respectively. In 2008, prior to the full effects of the last recession being felt, they were higher, at $1,616 and $78.65. In 2005, they were $1,365 and $63.71.[79]
For any given district, the following calculation yields the guaranteed minimum funding level under the foundation aid and salary incentive aid calculations:
Guaranteed Foundation and Incentive Minimum =
(Foundation Aid Factor X WADM) + (Incentive Aid Factor X 20 X WADM) =
(Foundation Aid Factor + (Incentive Aid Factor X 20)) X WADM.
In 2014, the two factors together determined that each unit of WADM was guaranteed to be funded at $3,032 ($1574 + ($72.90 X 20)) under the foundation and incentive aid calculations.[80] Careful scrutiny of the sample district calculation, ignoring transportation aid, shows the relevance of the $3,032 total. However, the actual calculation of state aid for each district never uses this $3,032 total because different amounts must be netted out of each guaranteed amount under the foundation and incentive aid calculations. Only property tax proceeds are subtracted from the guaranteed salary incentive total. Several other sources of revenue are netted out of the guaranteed foundation total, as described above.
An oddity in the Oklahoma school funding system is that the key factors that determine minimum formula funding for school districts are backward-engineered by the state’s education department and not set by statute. Instead, these factors are calculated taking property tax and the other chargeable revenues, along with the state’s total formula appropriation, into account. The formula factors are calculated at least twice each year. An initial calculation occurs using data nine weeks into a school year to get the funding ball rolling, and again based on more precise WADM counts for the year in December. Monthly distributions to school districts are adjusted accordingly and can sometimes result in no further state aid distributions for the rest of a school year after the mid-year adjustment.[81]
Each year, the state’s appropriation for state aid formula funding is split into three parts. First, an amount is deducted from the total appropriation to account for transportation aid. The remainder is split in a proportional calculation. Three-sevenths (3/7ths) of the state’s appropriation net of transportation aid goes toward foundation aid for districts. Four-sevenths (4/7ths) goes toward incentive aid for districts.[82]
Why the 3/7 and 4/7 split? The answer lies in the fact that 15 mills of property tax counts toward the foundation formula and 20 mills of property tax counts toward the incentive formula for a total of 35 mills. Fifteen of 35 mills is 3/7ths of the total. Twenty of 35 mills is 4/7s of the total. So, for any given year, total foundation aid from the state is three-quarters of total incentive aid from the state (3/7 ÷ 4/7 = 3/4).
As was mentioned earlier, the state produces a detailed formula calculation sheet for each school district every year. Each sheet shows the guaranteed foundation total, a breakdown of chargeables, net foundation aid, transportation aid, and net incentive aid for a given district as well as other information. There is also a summary sheet for the state as a whole that shows the guaranteed foundation total for the state, total state foundation aid to districts, total state transportation aid to districts, and total incentive aid to districts. To see that total foundation aid is always set to be 3/7 of the total state aid net of transportation and incentive aid is 4/7 of this total, see Table 15.
Table 15: The Relationship between Total State Foundation Aid and Total State Salary Incentive Aid[83]
| Year | Total State Foundation Aid to Districts (3/7) | Total State Incentive Aid to Districts (4/7) | Foundation/ Incentive Ratio (3/7 ÷ 4/7 = 3/4 = .75) |
| 2012 | $767,412,852 | $1,022,203,337 | 0.751 |
| 2013 | $766,368,954 | $1,021,930,504 | 0.750 |
| 2014 | $775,276,408 | $1,034,479,371 | 0.749 |
| 2015 | $791,127,157 | $1,056,569,575 | 0.749 |
Because there is some error in the calculations and very likely some judgement calls are necessary in estimating some parameters that can only be done by those officially charged with this task, explicit numerical calculations of the funding factors will not be made here. Clearly though, using ADH and WADM totals, the calculation of the foundation and incentive funding factors works something like this:
Transportation aid is netted out from the state formula funding appropriation:
Total State Aid to Schools (legislatively determined) – Total State Transportation Aid =
Total State Foundation & Incentive Aid
Foundation aid factor is calculated:
- Total State Foundation & Incentive Aid X 3/7 = Total State Foundation Aid
- Total State Foundation Aid + Chargeables =
Total State Guaranteed Foundation Funding
- Total State Guaranteed Foundation Funding ÷ Statewide Total WADM =
Foundation Funding Factor
Incentive aid factor is calculated:
- Total State Foundation & Incentive Aid X 4/7 = Total State Incentive Aid
- Total State Incentive Aid + 20-mill Property Tax from all Districts Statewide =
Total State Guaranteed Incentive Funding
- Total State Guaranteed Incentive Funding ÷ Statewide Total WADM =
Guaranteed Incentive Funding Factor per WADM
- Guaranteed Incentive Funding Factor per WADM ÷ 20 =
Incentive Funding Factor
General Remarks about Funding Factors
- While there is doubtlessly a good deal of discussion in the legislature about how much total money districts will have to spend when the legislature determines its appropriation for total state aid to schools, the specific funding factors likely make up little of the conversation. In fact, there does not appear to be even so much as an explicit instruction in statute, the constitution, or in rule specifying the 3/7 and 4/7 proportions. The 15-mill and 20-mill property tax subtractions are quite explicit in law, though. However, because the chargeables under the foundation aid calculation can change significantly, the ratio of guaranteed foundation funding per WADM ($1,574 in 2014) to guaranteed incentive funding per WADM ($79.20 X 20 = $1,584 in 2014) not only deviates from equaling .75, but also changes from year to year as shown in Table 16.
Table 16: The Relationship between Guaranteed Foundation and Incentive Funding[84]
| Year | Guaranteed Foundation Funding per WADM | Guaranteed Incentive Funding per Mill per WADM X 20 | Ratio: Foundation/ Incentive |
| 2005 | $1,365.00 | $1,274.20 | 1.071 |
| 2008 | $1,616.00 | $1,573.00 | 1.027 |
| 2012 | $1,601.00 | $1,462.20 | 1.095 |
| 2013 | $1,583.00 | $1,452.00 | 1.090 |
| 2014 | $1,574.00 | $1,458.00 | 1.080 |
| 2015 | $1,609.00 | $1,465.80 | 1.098 |
- Though the state’s appropriation net of transportation aid is always split into 3/7 and 4/7 proportions for foundation and incentive aid, respectively, guaranteed foundation funding is always higher than guaranteed incentive funding and the proportions vary significantly from year to year. This calls into the question the logic of the separate guarantees. Perhaps there is some historical explanation, but given that the computation of the funding factors is not explicitly described in law, it is certainly not clear what this would be.
- The law, often through the state constitution, does at least partly specify chargeables or net calculations under each state aid calculation.[85] These chargeables are now entirely outside a school district’s control. In addition, the foundation aid millage most districts charge is higher than 15 mills and it is not the same across districts. All of these considerations call into question why the 3/7 and 4/7 proportional split is so closely followed. Regardless, there is an honest effort to implement legislative intent on the part of the Department of Education, even if that intent is old and unclear.
Formula Hold Harmless
One issue unmentioned to this point is that school districts are not necessarily funded on their most recent WADM counts. State law states that any given district will be funded based on its highest WADM of the current year or the previous two.[86] So, if a district is funded on its current WADM in a given year and then loses students and WADM count in subsequent years, the WADM used for funding purposes will not fall for two years. Clearly, the idea is to give planning and transition time to school districts that lose students. This means that if traditional districts were to lose a significant number of students to charter schools, the funding factors would be held artificially low, denying funding to growing charters, while preserving funding for districts suffering student losses due to competition.
One More Formula Issue – Penalties
School districts can have state aid reduced under certain circumstances, often but not always out of the direct control of the districts. To the extent that the threat of penalties incentivizes certain behavior, this has been successful. Penalties constitute small numbers in the state as a whole, and for individual school districts, they are not very high, either. The state can, at most, reduce aid to districts. It cannot confiscate local property tax revenues or any of the other dedicated revenues designated as chargeables. In 2014, the statewide detailed calculation sheet shows that $214,158 in penalties (0.02 percent of total net state aid) were assessed. Most districts suffered no penalties and for those that did, the penalties were small. Because they are so minor, penalties will receive only a cursory explanation here. Dollar amounts below come from the statewide detailed calculation sheet.
OCAS Noncompliance Penalty
OCAS stands for Oklahoma Cost Accounting System. Districts must be in compliance with reporting protocols regarding costs. If a district is not compliant, it loses increasing percentages of monthly payments of state aid until it does comply. [87] The total statewide OCAS noncompliance penalty in 2014 was a mere $479.
Per Pupil Revenue Exceeds 150 Percent of State Average Penalty
A district with this much revenue likely receives no foundation or incentive aid, but it would receive transportation aid and other revenues from the state such as the textbook allotment, which are not included in the aid formulas. These funds can be tapped for the penalty.[88] The per pupil revenue calculation is complicated, but total penalties amounted to only $45,834 in 2014.
Administrative Cost Penalty
Depending on the average daily attendance of a district, a certain percentage of all costs are allowed for central administration (school board, superintendent, and personnel administration and staff).[89] Only $17,645 in administrative cost penalties were counted against districts in 2014.
General Fund Carryover (Balance) Penalty
Depending on the “general revenues” (there are many revenue exclusions from this amount) of a school district, a maximum percentage of revenues to be retained at the end of the year is allowed. If retained funds are too high, they are essentially confiscated.[90] This penalty amounted to $150,200 in 2014.
Class Size Penalty
Maximum class sizes for various grades are specified and penalties assessed if class sizes are too large. This penalty, along with those listed above, are explicitly listed on district and statewide detail calculation sheets.[91] The total statewide under this penalty for 2014 was zero.
Other Penalties[92]
There are a number of other penalties for which no separate listings appear in the statewide detail calculation sheet for 2014. These include:
Per Pupil Revenue Exceeds 300 Percent of State Average Penalty
Maintenance of Effort Penalty (Failure to Maintain Spending on Special Education)
Minimum Teacher Salaries Penalty
Noncertified Teacher Penalty
Delinquent Personnel Reports Penalty
Noncompliance Penalty on Late Audits Penalty
Penalty for Too Few School Days or Hours
Gifted and Talented Penalty (Failure to spend enough on gifted and talented)
State Student Record System Noncompliance Penalty
The basic cause for these penalties is self-explanatory. There are various, often complex methods for determining their values, but they are so minor in their financial impacts that they are not worth spending a great deal of effort to understand.
School Formula Funding and Student Transfers
A fundamental issue regarding common school funding that arises especially around reform proposals such as education savings accounts, charter schools, and other school choice programs, has to do with how student movements into and out of the state and the traditional common schools system affects funding. For the sake of illustration, the Tulsa school district in Tulsa County will be used to show the impact of changing that district’s student count by 300 students (ADM). What happens to total and per-student funding in Tulsa with 300 students entering or leaving the district can be scaled up or down to other districts.
There are four possible scenarios for changes in student counts. First, students could transfer in from other Oklahoma school districts. Second, students could enter the district from other states or be entirely new students, transferring from private schools, from homeschools, or entering kindergarten. Third, students could transfer out to other school districts, or fourth, they could leave the state or leave the system through private and home schooling. In reality, districts experience student count changes for a variety of combinations of these scenarios, but each of these is explored in hypothetical purity in order to make it easier to understand this: State funds are the only funds that adjust to changes in student counts.
Suppose 300 students transferred into the Tulsa district in 2014 from other Oklahoma traditional districts and that, on average, each student counted as 1.6 WADM (the statewide average). That means Tulsa would gain 480 in WADM. In 2014, Tulsa had 67,381.12 in WADM. At $3,032 per WADM, the state formula guaranteed Tulsa $204,299,555.84 in funding. Of this Tulsa’s property taxes and other dedicated revenues (chargeables) amounted to $110, 426,231 and the state made up the difference. An additional 480 in WADM would have increased the total to $205,754,915.84. This change would not have impacted Tulsa’s revenues from property taxes or any of the other chargeables, meaning it is state money, transferred from other districts, that pays the additional $1,455,360 in guaranteed funding. Formula funding per ADM (per student) would have fallen slightly only because the new students carry a little less average WADM than the students already in Tulsa, whose WADM/ADM ratio is higher than the state’s, at 1.7. Average formula funding per student would have fallen from $5,104.20 to $5,102.32.
Now suppose the same number of students with the same average weight left the Tulsa district in 2014, transferring to other districts so that Tulsa lost 480 in WADM. That means $1,455,360 in state money would migrate to other districts as guaranteed funding would have fallen to $202,844,195.84. Once again, Tulsa’s $110.4 million in property taxes and other chargeables that count toward guaranteed funding stay with the district. Formula funding per student would rise slightly from $5,104.20 to $5,106.11.
Should 300 students leave or enter the Tulsa district and the state system, there is essentially no difference compared to the two scenarios above. A change of 300 students is miniscule in the system as a whole, so the funding factors will not change appreciably. Given the way the formulas work, when a new student enters the school system during a school year, either by moving into the state or transferring from private or homeschool education, the total amount of revenue throughout the system does not change. Only the path of state money (which districts get it) changes.
Now, suppose 3,000 students left traditional school districts and entered charter schools. Obviously, total funding to traditional districts would fall since they would have less WADM. However, total WADM in the state would remain constant. The funding factors per unit of WADM would not change except if charter schools continue not to provide transportation, statewide ADH would fall, requiring less transportation aid and leaving a larger amount of money from which the funding factors would be computed. Thus, funding per WADM would increase slightly. Traditional districts would benefit on a per ADM basis. Again, it is state money that migrates, not local money, and not dedicated state sources of funds. Considering all sources of funds, per student revenues to districts would rise.
Finally, if there had been 3,000 fewer students statewide, averaging 1.6 in WADM in 2014, the guaranteed funding per WADM would have risen to $3,045 since the state’s appropriations would have been divided over fewer students. Suppose all of those students had left the Tulsa district. Once again, nothing would have changed with respect to local property tax revenue or other chargeables. However, guaranteed funding would have dropped to $205,169,664. Some of the fall in WADM would have been compensated for by the increase in the per-WADM guarantee.
The hypotheticals with Tulsa losing students are simplified in the following sense: school districts are guaranteed funding based on the best of three years, the current year and the two years previous, as was explained above. School districts that lose students only see an immediate loss in guaranteed formula funding if the guaranteed funding per WADM drops. A drop in guaranteed funding is realized only if student and WADM counts remain lower.
General Remarks about Oklahoma’s Common School Formula Funding
- Time and again, small school districts are favored in the funding formulas. They receive a higher allocation under the transportation allotment through the ADH density calculation. The small school and sparsity weights are explicitly aimed at smaller districts, especially those that serve thinly populated areas. The administrative cost penalty also makes greater allowance for smaller districts. It would seem that if it is deemed necessary for allowances to be made for small districts, the allowance is easiest to understand in low population density situations and perhaps there should be just one such allowance.
- Student weights under the WADM calculation have a huge and disparate impact on school district funding. These weights are old, having been devised at least 20 years ago. Even at the time of their creation, it is likely that their logic could have been, and probably was, disputed. Now they are even more disputable. One reason is that the internet now exists and its use as a productive tool could significantly impact the differential costs of providing educational services for high school and for those with learning disabilities.
- While there is a maintenance of effort penalty for spending on special education and another for gifted education, there is otherwise no requirement that the money that flows to a district because of a specific student be spent on that student. The administration of a system that drilled down to such a level of accountability would probably be excessively costly. However, this does beg the question of the necessity or even desirability of so many different student category weights.
- Recall that in 2014, there were 61 districts that received no foundation aid and 28 that received no incentive aid. All 28 of the districts that received no incentive aid also received no foundation aid. It is easy to see why some districts get incentive aid but no foundation aid now that the basics of computing the funding factors are known. In order to not receive incentive aid, a district must only be rich in terms of property value. Some districts may not be property rich enough to miss out on incentive aid, but the other chargeables under the foundation aid calculation such as the gross production tax and motor vehicle tax can be sufficiently high to keep the district from getting foundation aid.
- The logic behind the three-part guaranteed funding formula at the current time is unclear. It would seem that the only reason for keeping it is intertia – the fact that people are used to it and feel like they understand it well enough, or that its complexity gives those who understand it some kind of advantage. The transportation aid is low enough that it is almost irrelevant. This is especially so for the teacher experience/degree weight. The foundation and incentive funding factors vary relatively to each other randomly, according to what is happening with dedicated funds relative to property taxes. The current system is already almost equivalent to having a single factor and including all 35 mills and the other chargeables in a single subtraction.
- When a few districts see a relatively big increase in their chargeables, such as when the gross production tax increases due to an oil bonanza, or real estate development in a few areas pushes up property values, this benefits funding levels for ALL school districts. This is because the amount that determines the funding factors includes the total local revenue from the chargeable revenue sources.
- Despite the state constitutional prohibition of a statewide property tax,[93] the state has effectively appropriated 35 mills of local property tax entirely to the state’s defined purposes. A statewide property tax would simply be a property tax applied statewide for which the state also determines the rate, and that the state appropriates for its purpose. The formula automatically assumes local government will tax property at 38 mills for school funding purposes (including 75 percent of the 4-mill county tax).
- Oklahoma’s property tax assessment system has not been studied for the purposes of this paper. However, it is clear that if property is not assessed in an equal manner across the state, property owners whose assessments are high relative to actual value will bear a greater burden and effectively more of the system statewide, not just locally, than those whose assessed values are low relative to actual value.
- Because school districts’ current-year state foundation aid calculation is based on chargeables from the prior year, districts whose chargeables are increasing see a funding advantage in the current year. This is because current-year chargeable collections are immediately available for use, but the lower prior year amounts are all that are counted against the district’s state foundation aid. Districts whose chargeables are falling are at a current-year disadvantage. Their current revenues for immediate use are lower than the prior year’s collections. Yet, it is those higher values that count against their state foundation aid.
Sources of Funding that Fall outside the Formulas
Already described above are the funding sources that count toward state formula funding. These include the 15+-mill Certification of Need levy, 5 mills of the 15-mill County levy, 3 mills of a separate County 4-mill levy, the 5-mill Emergency levy, the 10-mill Local Support levy, the gross production tax, school land earnings, part of the motor vehicle tax, and the R.E.A. tax. These, along with a specific “Financial Support of Schools” appropriation from the state, make up the sources of formula funding. There are other sources of revenue for districts, however. In fact, while total formula funding in 2014 amounted to $3.3 billion, total spending by school districts amounted to over $5 billion.[94]
25 Percent of the 4-mill County Tax
The state constitution is quite specific that only 75 percent of the 4-mill County Tax will count toward foundation funding. This means 25 percent of the tax (1 mill of 4 mills) is, in a sense, free and clear to the districts. That is, it does not count against their state aid. For the 2014 school year, the 4-mill county tax totaled $116.5 million, statewide. Of this, $29.13 million will fall outside of the formulas.[95]
5-mill Building Fund Levy
Every district can, with the permission of voters, levy a property tax of up to 5 mills to be used for building facilities and equipment.[96] Under this levy, revenues amounted to $146.6 million statewide.[97] Unlike the other levies already discussed, school districts have complete discretion over the rate as long as it does not exceed 5 mills, although they do not have complete discretion over how the money is spent.
Sinking Fund Millage
Sinking funds are for the purpose of paying back bonds, a form of government borrowing which is mostly issued for constructing school buildings. In bond elections for approval of the bonds and the property tax to pay them back, voters are told an approximate millage that will result from the issuance of the bonds. However, in order to keep the risks low for investors and interest rates correspondingly low, there is no limit put on sinking fund millage. In the event of a large drop in property values, millage is allowed to rise to whatever level is necessary to make bond payments. Thus, there is no specific rate associated with this property tax. It amounted to $547 million in district revenue in 2014.[98]
State Appropriation for Health Insurance (Flexible Benefit Allowance)
For 2014, this appropriation amounted to a total of $367,780,862. The state could stop appropriating funds for school employee health insurance and flow the funds to districts and charter schools through the formulas. Whether this is doable politically and the degree to which legal issues could get in the way will not be evaluated here. But, if this appropriation were converted into part of the general support for schools appropriation in 2014, it would have resulted in about $600 of additional funds per WADM, or $970 per student.
State Textbook Funds
For 2014, $33 million were appropriated for textbooks statewide. Money is passed to school districts at the rate of $55 per unit of average daily attendance. Attendance is an odd choice for passing out textbook funds since it would seem that each enrolled child would need a textbook and average daily attendance is a lower number than average daily membership.[99] In recent years, the legislature has allowed these funds to be used for whatever districts decided, in their discretion, was needed. If the money were flowed through the formulas in 2014, guaranteed funding per WADM would have been about $54 higher.
Other State Appropriations
In 2014, besides formula funding for schools at $1.83 billion, $368 million for health insurance, and $33 million in textbook funding, the state appropriated $3.4 million to a fund to help with school consolidation, $1 million to the Oklahoma Parents as Teachers program, $8 million to a remediation program (ACE), $25 million to early childhood education, and another $31 million to various programs like Teach for America, staff development, and reading and math initiatives. All totaled, these additional programs, health insurance, and textbook funding amounted to about $470 million. If the entire $470 million could be converted to formula funding, making these funds available to charter schools as well as traditional districts, it would have amounted to an additional $430 per WADM.[100] Excluding health insurance and textbook funding, if the remaining $68 million in appropriations were converted to formula funding, it would have amounted to over $110 in additional funding per WADM in 2014. Total 2014 state appropriations amounted to $2.4 billion, with some of this such as agency funding, teacher retirement, and federal funding matches not being convertible to formula funding. None of this is intended pass judgement on any of the specific programs funding flows to outside of formula funding. It is just intended to point out options.
School District Funding Sources and Shares
With 540 school districts and charter schools spread all over a diverse state, district revenues and expenditures are not going to be the same. This paper has mostly been about revenue sources associated with the state’s formula funding system, although school districts receive a significant amount of funding from other sources. One source is the federal government, which subsidizes school meals and funds school programs for children whose families have modest incomes. Although the bulk of federal funding has little to do with funding education directly, they are justified as making disadvantaged children ready and able to learn. Still, school districts arguably serve mostly as pass-through entities for federal funds.
Another source of funds for school districts actually serves mostly to defray costs of optional activities that are often only tangentially related to education. Sporting events, for example, result in revenues to districts from ticket sales. Some district revenues, such as charges for workbooks, simply defray costs.
As has just been described above, some state funding is aimed at providing education system personnel with specific benefits that might or might not otherwise be offered by any particular district. School districts, for example, have no discretion over the flexible benefit allowance. They have little discretion over remediation funds, special math and reading funds, and parents as teachers funds, yet districts are credited with these funds as revenues just the same as if they were general revenue funds over which the districts have wide discretion.
Table 17 shows a breakdown of school funding for several districts, including one elementary district and one charter school, that reflects an attempt to keep things relatively simple, but fails to make some distinctions that would be good to make. There just is not room. District and county taxes, for example, includes the sinking fund and building fund millages. For some districts, these can be significant. Nonetheless, this breakdown allows the careful observer to notice several things. First, note that the charter school gets more than just formula funding. Charters can benefit from other appropriations for state education programs, including the flexible benefit allowance. The charter school also receives significant funding from the federal government, though not at a higher rate than some traditional districts.
The districts in Table 17 are listed by size, smallest to largest, with the first five in the 1 to 500 student range, the next three in the 500 to 1,000, the three after that in the 1,000 to 10,000, and the last three larger than 10,000. It is difficult to notice much of a pattern, except that per-student funding appears to be higher in some districts mainly because of federal funding. It appears that districts that are relatively property poor, and so receive a higher percentage of total revenue in the form of state funds, also do relatively well with respect to federal funding. This makes sense since both the state and the federal government are subsidizing low-wealth and low-income students.
Table 17: Select School Districts’ Revenue Sources and Spending per Student[101]
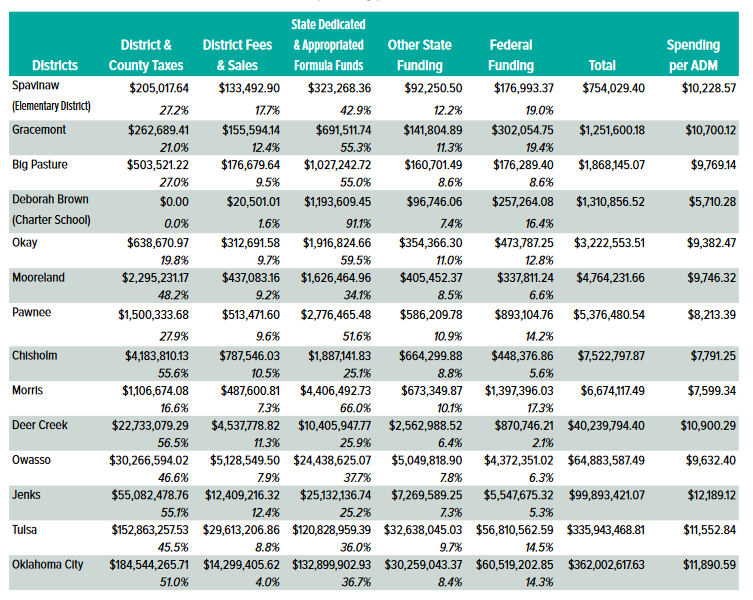
Conclusion
In round numbers, about 41 percent of school district revenues in 2014 came from local sources, 48 percent from the state, and 12 percent from the federal government.[102] Of the $5.9 billion in total revenue, $1.84 billion, or 31 percent, was in the form of state formula aid to districts. Another $427 million in state dedicated funds, 7.2 percent of the total, counted toward the formula. District and county taxes effectively appropriated by the state provided almost $1.1 billion (19 percent of the total) of their formula funding. Put differently, over 57 percent of the $1.9 billion in local property taxes collected in 2014 was controlled by the state. It is no wonder that the allocation of state aid is controversial.
Hopefully, this document has been helpful to those who wish for a better understanding of Oklahoma’s school formula funding system. Perhaps this will serve as an inspiration to make the system simpler and more rational. It would seem that now is the time to think in such terms. The formulas are on automatic pilot. Hardly anyone has a clue how they work and their implications. They are badly outdated. If nothing else, perhaps this publication will help show just how true these characterizations are.
Appendix A: Oklahoma’s Mega School Districts
Table A-1: Thirteen Districts with More Than 10,000 Students (ADM)
| District | ADM |
| Mustang | 10,008.54 |
| Jenks | 11,146.33 |
| Midwest City-Del City | 14,428.93 |
| Lawton | 15,240.45 |
| Norman | 15,466.27 |
| Union | 15,485.87 |
| Broken Arrow | 18,125.98 |
| Putnam City | 19,192.88 |
| Moore | 22,886.03 |
| Edmond | 22,979.98 |
| Tulsa | 39,700.48 |
| Oklahoma City | 40,383.41 |
| Total | 245,045.15 |
Appendix B: Oklahoma’s Rich Districts in 2014
Table B-1: The 63 Districts That Received No State Foundation Aid in 2014
| District | County | ADM | District | County | ADM |
| Aline-Cleo | Major | 154.15 | Keyes | Cimarron | 68.50 |
| Alva | Woods | 1,024.03 | Kildare* | Kay | 79.73 |
| Arnett | Ellis | 193.42 | Kiowa* | Pittsburg | 314.44 |
| Balko* | Beaver | 153.30 | Laverne | Harper | 472.23 |
| Banner* | Canadian | 185.08 | Leedey* | Roger Mills | 210.48 |
| Beaver | Beaver | 367.02 | Maple* | Canadian | 153.03 |
| Billings | Noble | 62.22 | Medford* | Grant | 294.98 |
| Buffalo | Harper | 306.51 | Mill Creek* | Johnston | 146.18 |
| Burlington* | Alfalfa | 143.25 | Oakdale* | Oklahoma | 637.87 |
| Calumet* | Canadian | 284.36 | Okarche | Kingfisher | 308.43 |
| Calvin* | Hughes | 172.33 | Pond Creek-Hunter* | Grant | 338.43 |
| Canute | Washita | 429.01 | Reydon* | Roger Mills | 127.65 |
| Cashion | Kingfisher | 509.68 | Sayre* | Beckham | 763.44 |
| Cherokee | Alfalfa | 368.04 | Seiling | Dewey | 416.09 |
| Cheyenne* | Roger Mills | 370.12 | Sentinel | Washita | 335.58 |
| Chouteau-Mazie | Mayes | 889.52 | Sharon-Mutual | Woodward | 301.18 |
| Cimarron | Major | 278.66 | Shattuck | Ellis | 370.76 |
| Cleora* | Delaware | 113.65 | Springer | Carter | 213.77 |
| Coalgate | Coal | 710.13 | Straight* | Texas | 51.90 |
| Cordell | Washita | 754.16 | Stroud* | Lincoln | 827.23 |
| Cushing | Payne | 1,802.95 | Stuart | Hughes | 272.07 |
| Deer Creek-Lamont | Grant | 172.11 | Sweetwater* | Roger Mills | 134.76 |
| Fargo* | Ellis | 209.01 | Taloga* | Dewey | 66.91 |
| Forgan | Beaver | 149.55 | Timberlake | Alfalfa | 272.11 |
| Fort Supply* | Woodward | 119.70 | Turpin | Beaver | 425.68 |
| Freedom* | Woods | 89.31 | Velma-Alma | Stephens | 450.60 |
| Frontier* | Noble | 370.81 | Vici | Dewey | 343.96 |
| Gage | Ellis | 89.76 | Waynoka* | Woods | 288.49 |
| Graham-Dustin | Okfuskee | 157.86 | White Oak | Craig | 58.75 |
| Hammon* | Roger Mills | 271.81 | Wynnewood | Garvin | 706.67 |
| Hardesty* | Texas | 92.81 | Wynona | Osage | 118.68 |
| Indianola | Pittsburg | 232.94 | Total ADM | 20,797.84 |
*Also received no State Incentive Aid (28 districts)
Appendix C: A Hypothetical Teacher Experience Weight Calculation
Suppose we have a very small school district teachers in positions as shown in the following table. This is purely hypothetical. Table C-1 below shows each teacher’s position, years of experience, and degree level. The weight level on the right comes from assigned experience/degree weights determined in law and reflected in Table 9 above.
Table C-1: Hypothetical Faculty that Does Not Qualify for Teacher Weight
| Teacher | Position | Experience (years) | Degree | Weight |
| A | Pre-kindergarten | 1 | Bachelor’s | .7 |
| B | Kindergarten | 5 | Bachelor’s | .8 |
| C | Kindergarten | 8 | Bachelor’s | .9 |
| D | Special Ed | 4 | Bachelor’s | .8 |
| E | 1st Grade | 21 | Bachelor’s | 1.2 |
| F | 2nd Grade | 3 | Bachelor’s | .8 |
| G | 3rd Grade | 8 | Bachelor’s | .9 |
| H | 4th Grade | 14 | Bachelor’s | 1.1 |
| I | 5th Grade | 7 | Bachelor’s | .9 |
| J | 6th Grade | 5 | Bachelor’s | .8 |
| K | English/Counselor | 4 | Bachelor’s | .8 |
| L | History & Geography | 14 | Bachelor’s | 1.1 |
| M | US History/Athletics | 16 | Bachelor’s | 1.2 |
| N | Science | 10 | Bachelor’s | 1.0 |
| O | Mathematics/Technology | 0 | Bachelor’s | .7 |
| P | English/Reading | 28 | Bachelor’s | 1.2 |
| Q | Spanish/Library | 12 | Bachelor’s | 1.1 |
| R | Athletics/Speech | 0 | Bachelor’s | .7 |
| S | Special Ed | 2 | Bachelor’s | .7 |
| T | Mathematics/Technology | 4 | Bachelor’s | .8 |
| U | Agriculture | 15 | Bachelor’s | 1.1 |
| V | Athletics | 18 | Bachelor’s | 1.2 |
| W | Government/Athletics | 6 | Master’s | 1.1 |
| X | English/Speech/Reading | 20 | Bachelor’s | 1.2 |
In this case, the teacher experience index is 0.905. This is obtained by adding all the weights in the far right column and dividing by 24, the number of teachers. This is not enough to allow this district to claim any teacher experience weight at all since .905 is less than the state’s average of 1.0806.
Now suppose all the positions stay the same except that there is a good deal more years of experience for many of the teachers and two additional Master’s degrees. Table C-2 shows changes in only hypothetical experience and degrees, along with the corresponding change in weight in bold in order for this district to receive the teacher weight.
Table C-2: Hypothetical Faculty that Does Qualify for Teacher Weight
| Teacher | Position | Experience (years) | Degree | Weight |
| A | Pre-kindergarten | 1 | Bachelor’s | .7 |
| B | Kindergarten | 12 | Bachelor’s | 1.1 |
| C | Kindergarten | 8 | Bachelor’s | .9 |
| D | Special Ed | 4 | Bachelor’s | .8 |
| E | 1st Grade | 21 | Bachelor’s | 1.2 |
| F | 2nd Grade | 24 | Bachelor’s | 1.2 |
| G | 3rd Grade | 8 | Bachelor’s | .9 |
| H | 4th Grade | 14 | Bachelor’s | 1.1 |
| I | 5th Grade | 23 | Bachelor’s | 1.2 |
| J | 6th Grade | 15 | Bachelor’s | 1.1 |
| K | English/Counselor | 11 | Bachelor’s | 1.0 |
| L | History & Geography | 17 | Bachelor’s | 1.2 |
| M | US History/Athletics | 16 | Bachelor’s | 1.2 |
| N | Science | 10 | Bachelor’s | 1.0 |
| O | Mathematics/Technology | 19 | Bachelor’s | 1.2 |
| P | English/Reading | 28 | Master’s | 1.4 |
| Q | Spanish/Library | 12 | Bachelor’s | 1.1 |
| R | Athletics/Speech | 6 | Bachelor’s | .9 |
| S | Special Ed | 12 | Bachelor’s | 1.1 |
| T | Mathematics/Technology | 4 | Bachelor’s | .8 |
| U | Agriculture | 15 | Master’s | 1.3 |
| V | Athletics | 18 | Bachelor’s | 1.2 |
| W | Government/Athletics | 13 | Master’s | 1.3 |
| X | English/Speech/Reading | 20 | Bachelor’s | 1.2 |
Now this hypothetical district has a teacher experience/degree index of 1.0875. Note that while it would help the index for this school if more teachers had Master’s degrees, most with a Master’s move on to administration. Note also that very few teachers can have fewer than 8 years’ experience if the district is to have a chance of qualifying for the teacher experience weight which, recall, is calculated as follows:
Weighted Teacher WADM = (Weighted Average District Teacher – Weighted Average State Teacher) X
.7 X (Grade Weighted ADM + Economically Disadvantaged ADM)
The difference between the district index value and the state’s is 0.0069 (1.0875-1.0806). This difference is “discounted” to 70 percent of its actual value by the formula when computing the weight. Then it is multiplied by the sum of grade-weighted ADM and educationally disadvantaged ADM. This hypothetical district has a grade-weighted ADM of 374.26 and a relatively low economically disadvantaged weight of 25.75. The result is:
.0069 X .7 X (374.26 + 25.75) = 1.449.
In 2014, 1.449 of WADM was worth $4,393.37 (1.449 X $3,032). The modest payoff is due to: 1) the state’s floating experience/degree index, 2) the high degree of teacher experience required to obtain this weight at all, and 3) the discounting of the local/state index difference. Consequently, the very low value of the teacher experience/education index weight that results has essentially no incentive value whatsoever. In addition, considering what the salaries would be for teachers in Table C-2 compared to the salaries paid to those in Table C-1, the value of the teacher experience weight to the second district is paltry.
If this district’s student population were 63 percent economically disadvantaged (the state’s average), then the economically disadvantaged ADM would be closer about 48. As a result, the teacher experience/degree index weight would be $6,183.81, still not a lot of additional value.
This hypothetical example and the fact that the teacher index weight is only 0.8 percent of statewide WADM (Table 11) suggests that the teacher experience/degree index weight is of little value to anyone and could be abolished with little ramification.
________________________
- The main sources relied upon in the research and writing of this document include:Oklahoma School Finance: Technical Assistance Document (Oklahoma City: State Department of Education, 2014), accessed July 6, 2015, http://ok.gov/sde/sites/ok.gov.sde/files/documents/files/FY2014%20TAD.pdf.
Renee McWaters, Executive Director, Office of State Aid, Financial Services Division, Oklahoma Department of Education, interview, May 19, 2015.
FY 2014 Final Detail Weight Sheets (Oklahoma City, OK: Oklahoma State Department of Education), accessed July 6, 2015, http://www.ok.gov/sde/sites/ok.gov.sde/files/documents/files/detailweightB17012FV%20010214_0.pdf.
FY 2014 Final State Aid Calculation Sheets (Oklahoma State Department of Education), accessed July 6, 2015, http://www.ok.gov/sde/sites/ok.gov.sde/files/documents/files/Final%20State%20Aid%20Calculation%20Sheets%2006162014.pdf. ↑
- 2014 – OCAS – School District Expenditures (Oklahoma City, OK: Oklahoma State Department of Education), 13, accessed July 6, 2015, https://sdeweb01.sde.ok.gov/OCAS_Reporting/docs/ExpenditureReportFromOcasStatewide2014.pdf. ↑
- 2014 – OCAS – School District Revenue Report (Oklahoma City, OK: Oklahoma State Department of Education), 3, accessed July 6, 2015, https://sdeweb01.sde.ok.gov/OCAS_Reporting/docs/RevenueReportFromOcasStatewide2014.pdf.Expenditures exceed costs as a result of an accounting anomaly not yet identified. A federal accounting of expenditures yields a much lower number for Oklahoma. ↑
- Anderson, Steve, “Public School Results at Elite Prep-School Prices,” Perspective 17:1 (January 2010): 4-7, accessed July 6, 2015, http://www.ocpathink.org/publication/numbers-game. ↑
- 2014 – OCAS – School District Revenue Report, 3. Author calculations. ↑
- Oklahoma School Finance: Technical Assistance Document (Oklahoma City: State Department of Education, 2014), 14, accessed July 6, 2015, http://ok.gov/sde/sites/ok.gov.sde/files/documents/files/FY2014%20TAD.pdf. ↑
- Ibid. Author calculations. ↑
- “State Expenditure Details Based On All Funds Submitted By Districts,” Oklahoma State Department of Education, accessed July 6, 2015, https://sdeweb01.sde.ok.gov/OCAS_Reporting/StateExpenditureDetails.aspx. Author’s calculation is based on Average Daily Membership as the student count. ↑
- One newly consolidated “startup” district, Graham-Dustin, spent more, but it was such an outlier that to use it in this context would make comparisons meaningless. ↑
- Amounts and calculations by author based on data from “District Reports: School District Financial Information: Oklahoma Cost Accounting System,” Oklahoma State Department of Education, accessed July 6, 2015, https://sdeweb01.sde.ok.gov/OCAS_Reporting/Districts.aspx. ↑
- Ibid. ↑
- Ibid. ↑
- Average Daily Membership used for student counts. ↑
- Graham-Dustin is excluded from this calculation. See footnote 9. ↑
- Amounts and calculations by author based on data from “District Reports: School District Financial Information: Oklahoma Cost Accounting System.” ↑
- Average Daily Membership used for student counts. ↑
- Some error introduced due to the need to manually input district spending. ↑
- Graham-Dustin is excluded from this calculation. See footnote 9. ↑
- Oklahoma Statutes, Title 70, §18-201.1. “Weighted membership for calculation of Foundation Aid – 1997-98 and thereafter.” ↑
- Oklahoma Statutes, Subsection D, Paragraph 2(a) of Title 70, §18-200.1. “State Aid formula – 1997-98 and thereafter.” ↑
- Oklahoma Statutes, Subsection D, Paragraph 1 of Title 70, §18-200.1. ↑
- Oklahoma Statutes, Subsection D, Paragraph 2 of Title 70, §18-200.1. ↑
- Oklahoma Statutes, Subsection D, Paragraph 3 of Title 70, §18-200.1. ↑
- FY 2014 Final State Aid Calculation Sheets, (Oklahoma City, OK: Oklahoma State Department of Education), 540 accessed July 6, 2015, http://www.ok.gov/sde/sites/ok.gov.sde/files/documents/files/Final%20State%20Aid%20Calculation%20Sheets%2006162014.pdf. ↑
- FY 2014 Final State Aid Calculation Sheets. ↑
- FY 2014 Final State Aid Calculation Sheets, 365. ↑
- FY 2014 Final State Aid Calculation Sheets. ↑
- This is explained in more detail later in the body of the paper, but five separate constitutionally-defined property tax levies constitute the 38-mill total, the certification of need district levy (15 mills), 5 mills of the 15-mill county levy, the 5-mill emergency levy, the 10-mill local support levy, and 75 percent of the 4-mill county levy (3 mills). ↑
- FY 2014 Final State Aid Calculation Sheets, 511, 515, and 540. ↑
- The earliest bill that could be found that made a modest change in grade weights was HB 1657 in 1998. Most of the weights pre-date that bill. See “Oklahoma Session Laws – 1998, Section 204,” Oklahoma State Courts Network, Bill Section 5, accessed July 6, 2015, http://www.oscn.net/applications/oscn/DeliverDocument.asp?CiteID=369343. ↑
- Oklahoma Statutes, Subsection B, Paragraph 1 of Title 70, §18-201.1.Oklahoma School Finance: Technical Assistance Document, 18. ↑
- Three-year-olds with Individualized Education Programs (IEPs). Ibid. ↑
- Out of Home Placement refers to students remanded to juvenile programs. Districts only act as entities for money to pass through to cover the costs of these individuals’ ongoing educations. The overall amounts are small and since this represents a pass-through for districts, these weights are ignored for further discussion purposes. ↑
- See footnote 30. ↑
- Oklahoma Statutes, Subsection B, Paragraph 2 of Title 70, §18-201.1.Oklahoma School Finance: Technical Assistance Document, 18. ↑
- WADM/ADM counts are based on author calculations. WADM counts come from state aid calculation sheets for school districts. ADM counts come from individual district reports, “Oklahoma Cost Accounting System, School District Financial Information,” Oklahoma State Department of Education, accessed July 6, 2015, https://sdeweb01.sde.ok.gov/OCAS_Reporting/Districts.aspx. ↑
- Ibid. ↑
- Average Daily Membership used for student counts. ↑
- The Graham-Dustin district is included. ↑
- See footnote 36. ↑
- Oklahoma Statutes, Subsection B, Paragraph 3(a) of Title 70, §18-201.1. ↑
- Oklahoma Statutes, Subsection B, Paragraph 3(b) of Title 70, §18-201.1 ↑
- Author’s calculation based on data from “District Reports: School District Financial Information: Oklahoma Cost Accounting System.” ↑
- Author’s calculations. Dollar value based on the 2014 formula factor of $3,032 per WADM. ↑
- Graph based on author’s calculations. ↑
- Author’s manual count and, thus, subject to error from FY 2014 Final Detail Weight Sheets. ADM count based on data from “District Reports: School District Financial Information: Oklahoma Cost Accounting System.” ↑
- Author’s calculation. FY 2014 Final Detail Weight Sheets, 102. ↑
- Values based on author’s calculations. ↑
- Graph based on author’s calculations. ↑
- Oklahoma Statutes, Subsection B, Paragraph 4 of Title 70, §18-201.1.Oklahoma School Finance: Technical Assistance Document, 20. ↑
- Oklahoma School Finance: Technical Assistance Document, 20 and 26. ↑
- Oklahoma Statutes, Subsection B, Paragraph 4 of Title 70, §18-201.1. ↑
- FY 2014 Final Detail Weight Sheets, 583, 586 and 616. ↑
- Griffith, Michael, State Education Funding Formulas and Grade Weighting, (Denver, CO: Education Commission of the States Policy Brief, May 2005), 2-3, accessed July 6, 2015, http://www.lwvri.org/edstudy/2011-EdStudy-IVa-FundingFormulas.pdf. ↑
- FY 2014 Final Detail Weight Sheets, 619. ↑
- FY 2014 Final State Aid Calculation Sheets, 511, 515 and 540. ↑
- Oklahoma Constitution, Article 10, Section 9 (a). ↑
- Oklahoma School Finance: Technical Assistance Document, 6. ↑
- Ibid, 4. ↑
- Oklahoma Constitution, Article 10, Section 9 (b). ↑
- “History of the Trust,” The Commissioners of the Land Office,accessed July 6, 2015, http://www.clo.ok.gov/Administration/CLOHistory.htm. ↑
- Oklahoma School Finance: Technical Assistance Document, 8. ↑
- Ibid, 7. ↑
- Ibid. ↑
- Ibid, 8. ↑
- FY 2014 Final State Aid Calculation Sheets, 543. ↑
- Ibid. ↑
- Oklahoma Statutes, Subsection D, Paragraph 2 of Title 70, §18-200.1. “State Aid formula – 1997-98 and thereafter.” ↑
- Besides statute, the table is reproduced in:Oklahoma School Finance: Technical Assistance Document, 21, and in
Understanding Oklahoma’s School Funding Formula and Student-Centric Alternatives (Oklahoma City, OK: Oklahoma Educated Workforce Initiative, 2015), 23, accessed July 6, 2015, http://www.okewi.org/sites/www.okewi.org/files/OEWI_FundingOklahomasSchools.pdf. ↑
- Author’s plot using values from Oklahoma Statutes, Subsection D, Paragraph 2(b) of Title 70, §18-200.1 ↑
- Based on author calculations. ↑
- FY 2014 Final State Aid Calculation Sheets, 511, 515 and 540.“Oklahoma Cost Accounting System, School District Financial Information,” Oklahoma State Department of Education, Mooreland, Jenks, and Tulsa, accessed July 6, 2015, https://sdeweb01.sde.ok.gov/OCAS_Reporting/Districts.aspx. ↑
- FY 2014 Final State Aid Calculation Sheets, 543. ↑
- Oklahoma School Finance: Technical Assistance Document, 3. ↑
- Ibid.Oklahoma Constitution, Article 10, Sections 9 (c), (d) and (d-1). ↑
- Calculated using data from Table 5. ↑
- One will notice that state funding plus property taxes adds to more than the total given. Statewide, there is going to be quite a bit of “slop” in the calculations, district to district, causing the totals across the state not to precisely align.FY 2014 Final State Aid Calculation Sheets, 543. ↑
- FY 2014 Final State Aid Calculation Sheets, 540. ↑
- Numbers provided by Renee McWaters, Executive Director, Office of State Aid, Financial Services Division, Oklahoma Department of Education. ↑
- Given that the ratio of WADM to ADM was 1.6, on average, each student (one ADM) is guaranteed to be funded at $4,851. This amounts to a bit over half of the comprehensive per-student funding for the public education system in Oklahoma. ↑
- Oklahoma School Finance: Technical Assistance Document, 15-17. ↑
- This proportional split issue came up in conversation with Renee McWaters, Executive Director, Office of State Aid, Financial Services Division, Oklahoma Department of Education, interviewed May 19, 2015. ↑
- Author calculations using Final State Aid Calculation Sheets from FY 2012 – FY 2015. These can be obtained at http://ok.gov/sde/notice-allocation, accessed July 6, 2015,. ↑
- Author calculations ↑
- For example, the constitution specifically limits the amount that is allowed to count toward “the State guaranteed program”to 75 percent of the 4-mill county levy. It also prohibits any part of the local support and emergency levies from counting toward “the State guaranteed program.” These admonitions are clearly interpreted as applying only to the foundation aid portion of the net state aid calculation. Oklahoma Constitution, Article 10, Sections 9(b) and 9(e). ↑
- Oklahoma Statutes, Subsection A of Title 70, §18-200.1. ↑
- Oklahoma School Finance: Technical Assistance Document, 35. ↑
- Ibid, 29-30. ↑
- Ibid, 48. ↑
- Ibid, 44-47. ↑
- Ibid, 37-43. ↑
- Ibid 31-51. ↑
- Oklahoma Constitution, Article 10, Section 9 (a). ↑
- FY 2014 Final State Aid Calculation Sheets, 543.“Oklahoma Cost Accounting System, School District Financial Information,” Oklahoma State Department of Education, accessed July 6, 2015, https://sdeweb01.sde.ok.gov/OCAS_Reporting/?Year=2011. ↑
- 2014 – OCAS – School District Revenue Report, 1. ↑
- Oklahoma School Finance: Technical Assistance Document, 4. ↑
- 2014 – OCAS – School District Revenue Report, 1. ↑
- Ibid, 2. ↑
- Oklahoma School Finance: Technical Assistance Document, 11 and 14. ↑
- Ibid, 1. ↑
- 2014 – OCAS – School District Revenue Report (Oklahoma City, OK: Oklahoma Department of Education) for each district in the table. Available as “District Revenue Report” at “District Reports: School District Financial Information: Oklahoma Cost Accounting System,” Oklahoma State Department of Education, accessed July 6, 2015, https://sdeweb01.sde.ok.gov/OCAS_Reporting/Districts.aspx. ↑
- Error due to rounding. ↑